Demand🔗
Population, GDP, and Capital🔗
The demand sector defines the global energy demand for road and rail transport, air and water transport, residential and commercial (buildings), and traditional industry end uses, all of which may be met by direct use fuel, electric, and hydrogen carriers. The model determines the energy demand according to the stock of energy-consuming capital and its associated energy requirements. In addition to the traditional industrial processes, data center industry, driven primarily by the growth in artificial intelligence (AI), is another end use, but for which all energy is assumed to be electric.
Capital for all end uses except for data centers grows according to gross world product (GWP, but referred to in this document as GDP) as calculated by specified population scenarios and GDP per capita rates. GDP exogenously uses data reported through 2024 by the World Development Indicators (2025) for each region. Projections assume GDP per capita growth rates converge from what they are in the period leading up to the last historical year and converge to 1.5% through 2100. Population uses the UN historical data through 2021, followed by their projections for different fertility scenarios. By default, En-ROADS assumes the medium fertility projections, but the model can vary continuously between the lower and upper 95% confidence intervals.
Data Centers and Artificial Intelligence🔗
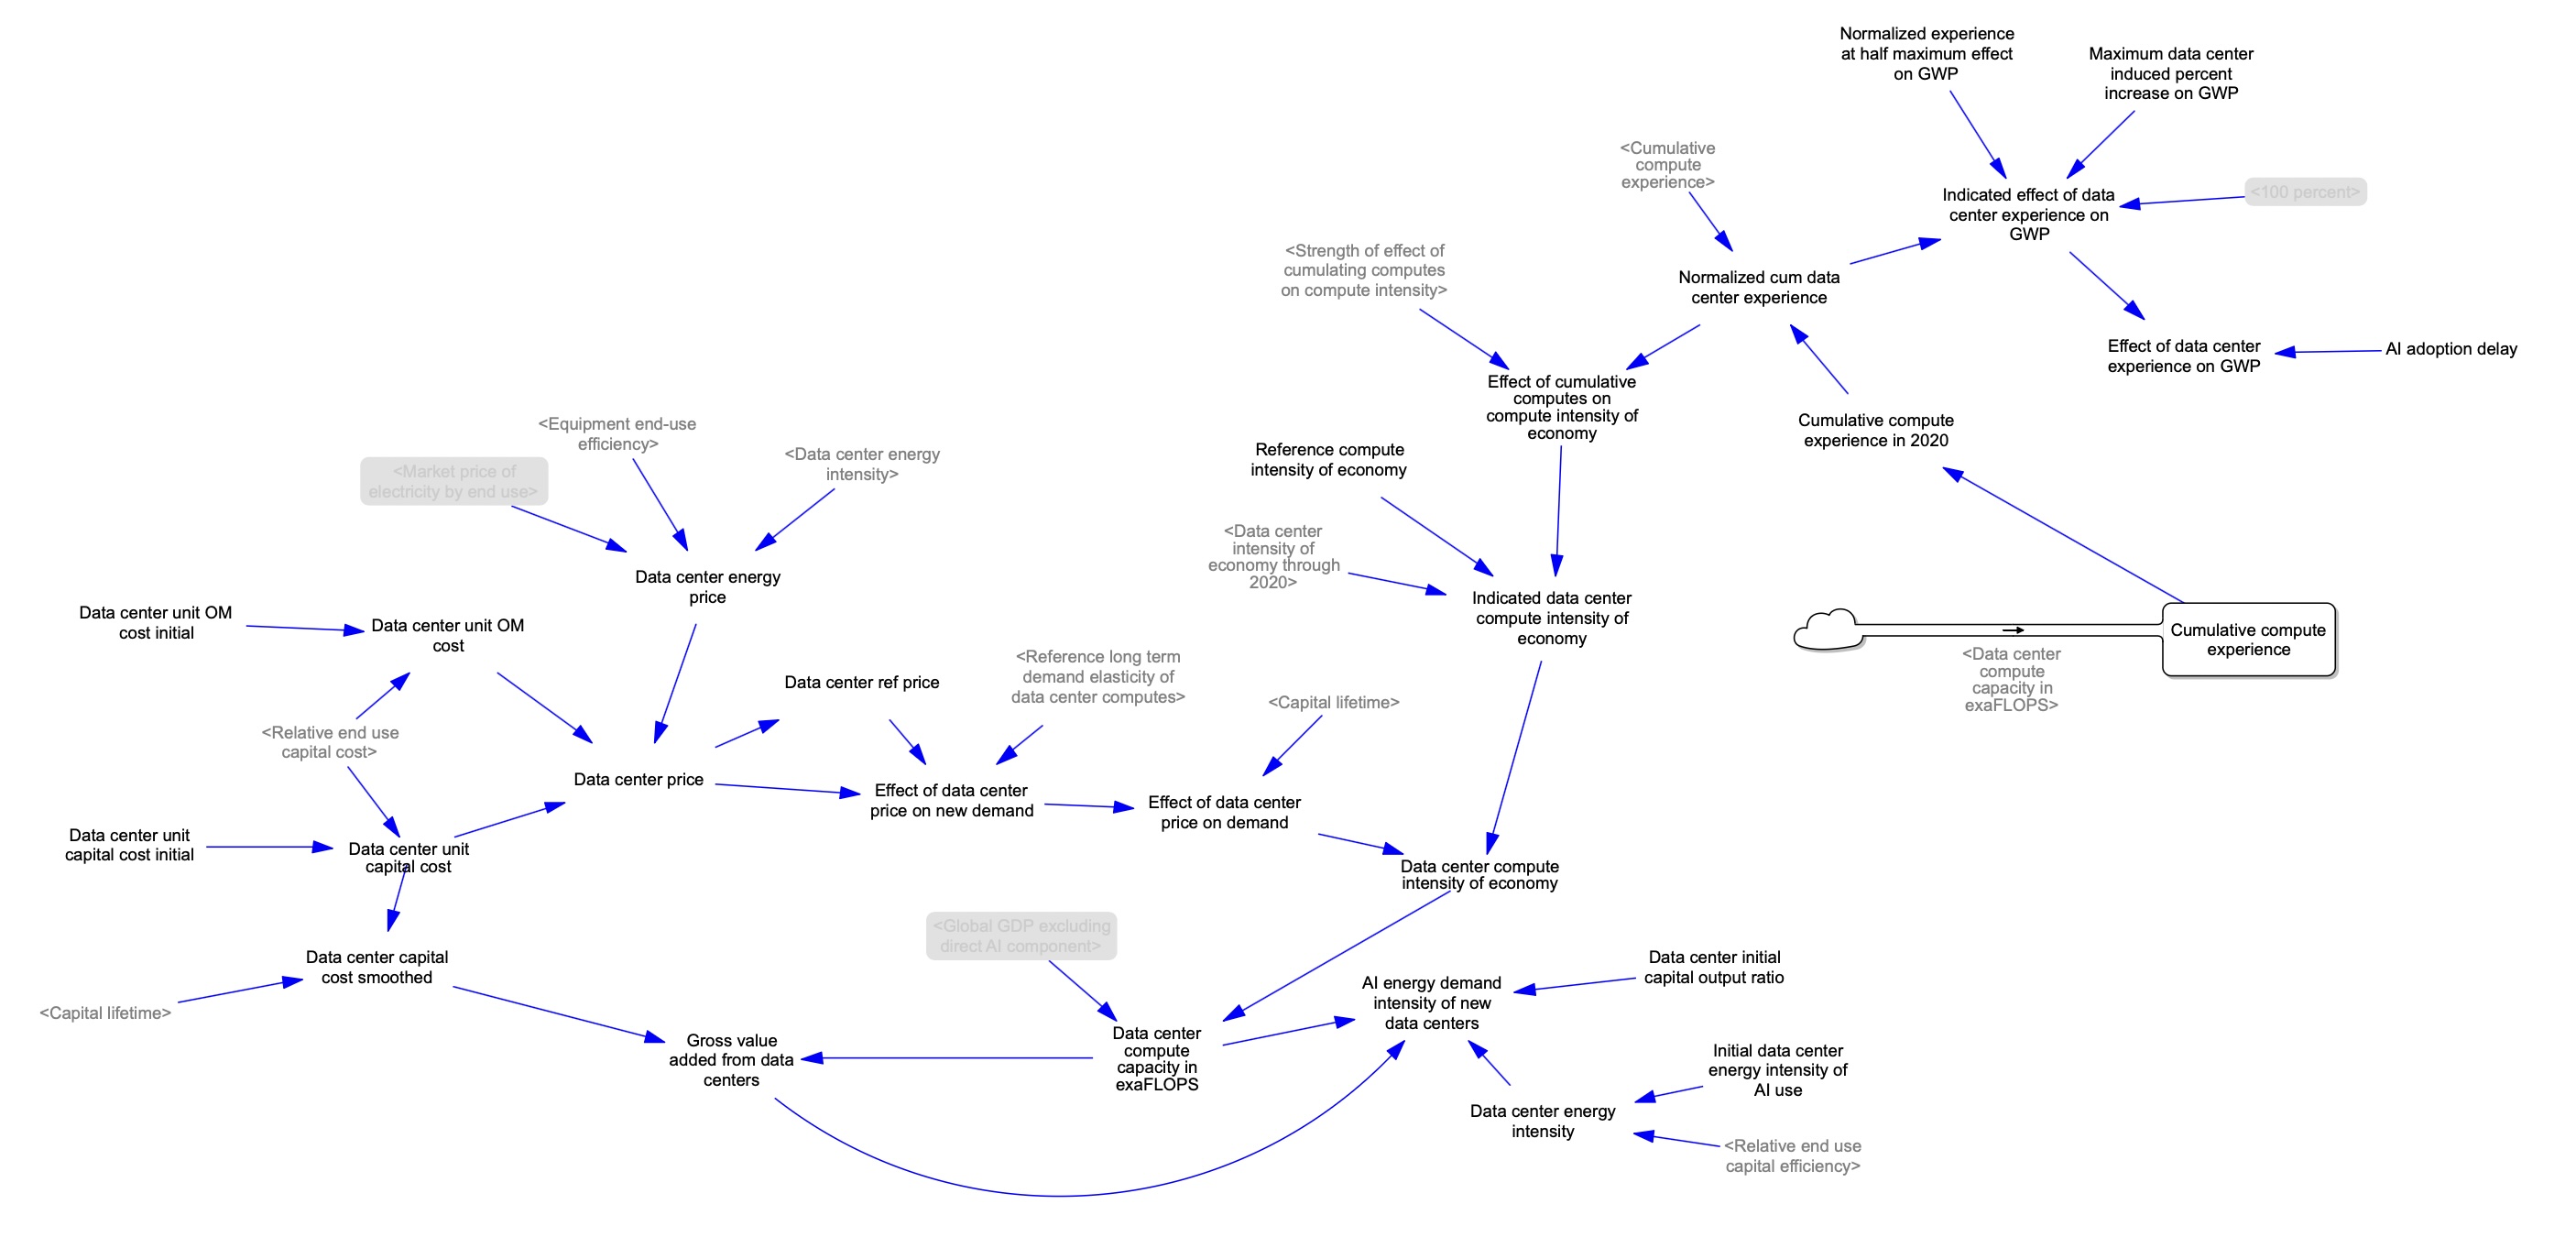
Data center capital is a function of direct and indirect feedbacks. As cumulative computing capacity is installed, there is an increase in the computing power intensity of GDP. Likewise, the long term demand elasticity increases the computing power intensity of GDP with a decrease in capital expenditures (CAPEX) and operations and maintenance (O&M) costs of data centers. According to the cost progress ratio, learning by experience and economies of scale leads to the decrease in CAPEX and O&M. According to the efficiency progress ratio, experience also reduces the electricity per unit of data center computation.
Data centers can also boost the productivity across sectors, thereby increasing the impact of those other sectors on the economic and climate systems. This indirect effect has potentially the most impact on the energy/climate system. General market clearing affects electricity production and consumption for data centers.
National Aggregation🔗
En-ROADS calculates actions and outcomes for the entire globe as a single region, with the exception of population and GDP, which are calculated for seven smaller regions. These are the same regions used in C-ROADS.
| Regions | Individual Nations |
|---|---|
| United States (US) | United States (US) |
| European Union (EU) | Austria, Belgium, Bulgaria, Cyprus, Czech Republic, Denmark, Estonia, Finland, France, Germany, Greece, Hungary, Ireland, Italy, Latvia, Lithuania, Luxemburg, Malta, the Netherlands, Poland, Portugal, Romania, Slovakia, Slovenia, Spain, Sweden |
| Other Developed Countries | Albania, Andorra, Armenia, Australia, Azerbaijan, Belarus, Bosnia and Herzegovina, Canada, Faeroe Islands, Fiji, Georgia, Gibraltar, Greenland, Holy See, Iceland, Japan, Kazakhstan, Kyrgyzstan, Macedonia, Moldova, Montenegro, New Zealand, Norway, Russian Federation, Serbia, South Korea, Switzerland, Tajikistan, Turkmenistan, Ukraine, United Kingdom, Uzbekistan |
| China | China |
| India | India |
| Other Developing A Countries | Brazil, Indonesia, Hong Kong, Malaysia, Mexico, Myanmar, Pakistan, Philippines, Singapore, South Africa, Taiwan, Thailand |
| Other Developing B Countries | Afghanistan, Algeria, American Samoa, Angola, Anguilla, Antigua and Barbuda, Argentina, Aruba, Bahamas, Bahrain, Bangladesh, Barbados, Belize, Benin, Bermuda, Bhutan, Bolivia, Botswana, British Virgin Islands, Brunei Darussalam, Burkina Faso, Burundi, Cabo Verde, Cambodia, Cameroon, Central African Republic, Chad, Chile, Colombia, Comoros, Congo, Cook Islands, Costa Rica, Côte d'Ivoire, Croatia, Cuba, Democratic People's Republic of Korea, Democratic Republic of the Congo, Djibouti, Dominica, Dominican Republic, Ecuador, Egypt, El Salvador, Equatorial Guinea, Eritrea, Ethiopia, Falkland Islands (Malvinas), Federated States of Micronesia, French Guiana, French Polynesia, Gabon, Gambia, Germany, Ghana, Grenada, Guatemala, Guinea, Guinea Bissau, Guyana, Haiti, Honduras, Hungary, Iceland, India, Iran, Iraq, Israel, Jamaica, Jordan, Kenya, Kiribati, Kuwait, Lao People's Democratic Republic, Lebanon, Lesotho, Liberia, Libya, Macao, Madagascar, Malawi, Maldives, Mali, Marshall Islands, Mauritania, Mauritius, Mayotte, Mongolia, Montserrat, Morocco, Mozambique, Namibia, Nepal, New Caledonia, Nicaragua, Niger, Nigeria, Niue, Oman, Palau, Panama, Papua New Guinea, Paraguay, Peru, Qatar, Réunion, Rwanda, Saint Helena, Saint Lucia, Samoa, São Tomé and Príncipe, Saudi Arabia, Senegal, Seychelles, Sierra Leone, Slovakia, Slovenia, Solomon Islands, Somalia, Sri Lanka, Sudan, Suriname, Swaziland, Syrian Arab Republic, Timor-Leste, Togo, Tokelau, Tonga, Trinidad and Tobago, Tunisia, Turkey, Turks and Caicos Islands, Tuvalu, Uganda, United Arab Emirates, United Republic of Tanzania, Uruguay, Uzbekistan, Vanuatu, Venezuela, Vietnam, Wallis and Futuna Islands, West Bank and Gaza, Western Sahara, Yemen, Zambia, Zimbabwe |
Notes:
- Other Developed Countries includes the Annex I countries within the UNFCCC process; the US and EU are also in the Annex I.
- Other Developing A Countries consists of the large developing countries with rising emissions.
- Other Developing B Countries consists of smaller developing countries, including the least developed countries and the small island states.
Capital🔗
The capital-output ratio relates the end use capital demand to global GDP and is assumed to be fixed.
Damage functions relating to GDP impacts from temperature change are described in detail in Damage to GDP. Capital is disaggregated by end use (residential & commercial, industry, road and rail transport, and air and water), as well as by carrier. The energy systems for each end use and carrier are chosen at the time of capital installation, and are embodied throughout the three vintages of the capital. However, the energy system of each capital vintage can be converted to a new one. A percent of buildings and industry capital is by definition electric, e.g., lighting, electronics, motors; these percentages are excluded from the structure for capital and associated energy requirements, and are instead added to the electric carrier capital for those sectors. The carrier of the energy system for each end use is embodied in the capital stock at the time of investment, but it can be converted to a new system. Energy system conversion captures the potentially different lifetimes of the energy system from the end use capital. For example, a building can last for 100 year but the furnace or heat pump to heat it has a lifetime of 20 years.
Carrier Choice🔗
Energy is delivered to end use capital via six potential carriers; there are four direct use carriers, an electric carrier, and a hydrogen carrier. Each of the direct use fuel carriers matches 1:1 with each of the fuels, i.e., coal, oil, gas, and biomass.
Shares of each carrier are allocated on the basis of the relative attractiveness of options according to a logit-type choice function, e.g.:
$$ Share[Carrier] = \frac{Attractiveness[Carrier]}{\sum Attractiveness[Carrier]} $$
Attractiveness is an exponential function of cost, complementary assets (for all uses by the hydrogen carrier and transport uses by all other carriers), and other factors including phase-out policies, technical feasibility, and other effects. Cost attractiveness is determined according to total cost of ownership (TCO), i.e., sticker price plus annual operation and maintenance costs plus energy costs.
Costs associated with the market price of energy are driven by the energy dynamics (e.g., extracted fuel commodity cycle, market clearing algorithms). Costs associated with the end use capital may be reduced by learning from end use experience, and for the electric and hydrogen carriers, reduced with subsidies. Operation and maintenance costs are estimated as a fraction of the TCO.
Finally, ancillary costs, reflecting the costs of complementary assets (CAs), i.e., the infrastructure to support the carrier, and other barriers to deployment, are also reduced by learning and subsidies and added to the TCO.
We assume that the CAs are built to meet the energy demand associated with the existing capital. However, there has to be sufficient availability of that infrastructure for consumers to choose the carrier. Accordingly, below that sufficient level, the attractiveness of a carrier is reduced from what it otherwise would be. For nonhydrogen carriers, the effect is relevant only for transport, reflecting fueling points/charging stations. For the hydrogen carrier, the effect applies to all potential end uses; the fueling infrastructure to meet future hydrogen demand is only available if policies support its building or, for air and water transport only, if direct use of fuels is banned. The installation of CAs is a function of the embodied carrier demand and, for the electric and hydrogen carriers, a policy to increase that. However, it is also constrained by a third order delay of the installation capacity. CAs have a normal lifetime but can also be retired early if the level exceeds the carrier demand. The level of CAs relative to that which is needed factors into the attractiveness of each carrier. Coal is assumed to have adequate availability for the relatively small amount of demand, notably for trains.
Fuel phase-out mandates and reduced fuel utilization mandates also affect attractiveness, as described in Drivers of Cost of Supply.
The logit-determined shares are also subject to policies of phasing out fuel-powered capital, thereby deploying electric or hydrogen using new capital. These policies are phased in over time. For road and rail transport, which reflects approximately 85% of all transport capital, fuel phase-outs result in electrification because hydrogen cannot compete cost effectively for this sector. Conversely, fuel phase-outs for air and water result in the deployment of hydrogen because electricity cannot compete cost effectively for this sector.
The carrier is chosen for new capital as well as for energy system conversions for each capital vintage. For the latter, the energy cost component for each vintage decision uses the average useful energy intensity and carrier end use efficiencies of that vintage.
Energy Intensity of Capital🔗
The useful energy intensity of new capital is governed by an exogenous user-specified technology trend. Likewise, the end use efficiency of each carrier is governed by an exogenous trend to reflect improvements from 1990 through today and expected improvements into the future. The intensity of energy required for each end use is the useful energy intensity divided by the end use efficiency of the carriers used to provide the energy. For each end use and carrier, two price effects, one based on energy costs and the other based on non-energy costs, also affect its useful energy intensity of new capital. Each price effect is formulated according to a distinct constant elasticity, such that as the cost relative to the reference increases, the energy intensity of that end use and carrier decreases. Likewise, as the cost relative to the reference decreases, the useful energy intensity of that end use and carrier increases. Another effect on the useful energy intensity of new capital captures its increase with the wealth gap closure, i.e., the closure of the gap between the average GDP per capita of developing countries and the initial average of developed GDP per capita.
The useful energy intensity of new capital and that of the three vintages of existing energy consuming capital accounts for aging, early discarding and retiring, retrofitting, and energy system converting. Retrofitting is replacing existing useful energy intensity with that of new capital. The decision to retrofit is affected by the ratio of energy costs of existing capital versus that of new. With energy system conversion, the end use efficiency of the carrier can change but useful energy intensity of the vintage does not. The decision to convert from an existing energy system is a function of its normal lifetime but adjusted by the costs to keep the energy system versus that of buying a new energy system. These costs depend on the useful energy intensities, end use efficiencies of new and each vintage, and market price of energy for each carrier and end use. With that, there is an additional cost associated with conversions, particularly that for transportation sectors, for which energy system conversions are rare.
The model carefully tracks final and primary energy demand, where the former is the energy consumed by the end use capital, and the latter is the energy needed to be generated to meet that demand accounting for thermal efficiency that is less than 100% and other losses.
Model Structure🔗