Model Structure🔗
En-ROADS is a system dynamics model. It consists of a set of ordinary differential equations in time. Variables calculated by integration are called “stocks” (also called “levels”); components of the rate of change of a stock are called “flows”; variables used for intermediate steps or calculating other values include auxiliary, constant, data, and initial variables.
Equations represent both physical processes and human decisions. There is no assumption of equilibrium or optimal decision making. The model represents the climate, environment, economy, and energy systems at the global level of aggregation and at the system-wide level of analysis.
En-ROADS is constructed using Vensim modeling software from Ventana Systems, and transformed into an online simulation via the SD Everywhere converter built by Climate Interactive and Todd Fincannon.
En-ROADS is calibrated to an extensive set of historical data, and its endogenous behavior is grounded in and made consistent with other models, in particular the Integrated Assessment Models used by the Intergovernmental Panel on Climate Change (IPCC).
Simulation Method🔗
The differential equations making up En-ROADS are non-linear and have no general closed form solution. Instead they are estimated numerically using the Euler method. At each time step (∆t), auxiliary and flow variables are calculated from previous values of stocks, along with constants and data as needed. Each stock is then computed by adding its previous value to the product of ∆t times the sum of all its flows. A sufficiently small time step is required for good approximation - a value of one eighth (0.125) year is appropriate in En-ROADS given the characteristic times and delays in the system as modeled.
En-ROADS starts from initial values in the year 1990 and runs endogenously through 2100. The value of each variable is stored every year. Aside from a small number of exogenous values, the model runs free - calibrated to external data but not driven by data.
Causal Structure🔗
At the highest level, En-ROADS calculates the concentration of each well-mixed greenhouse gas (CO2, CH4, N2O, PFCs, SF6, and HFCs), in the atmosphere, and the resulting climate change and other impacts. Greenhouse gas concentrations of each gas depend on its global cycle, driven by natural emissions and by anthropogenic emissions from energy, industry, and land use. Energy and industry emissions depend on total consumption (population times consumption per person), energy intensity of consumption, and emission intensity of energy and industry. Agriculture emissions and the land needed for farming depend on population and diets. The impacts of climate change create feedbacks that reduce consumption (by slowing economic growth), increase the land needed for agriculture (by lowering yield), and alter the biosphere.

Scope & Detail🔗
The model represents key processes in the energy system for a single, global region. Distinctions among regions are obviously important in the real world, but would considerably complicate the accounting framework of the model, particularly by introducing trade issues, and dilute the impact of any intervention, rendering it less useful for rapid scenario experimentation.
En-ROADS is dynamic, showing behavior over time, and does not find “optimal” results. There are a small number of exogenous inputs selected by the user. All other values are calculated endogenously using assumptions that can also be adjusted by the user.
- Exogenous (user inputs):
- Population
- Base GDP growth
- Technology breakthrough
- Policy choices
- Endogenous:
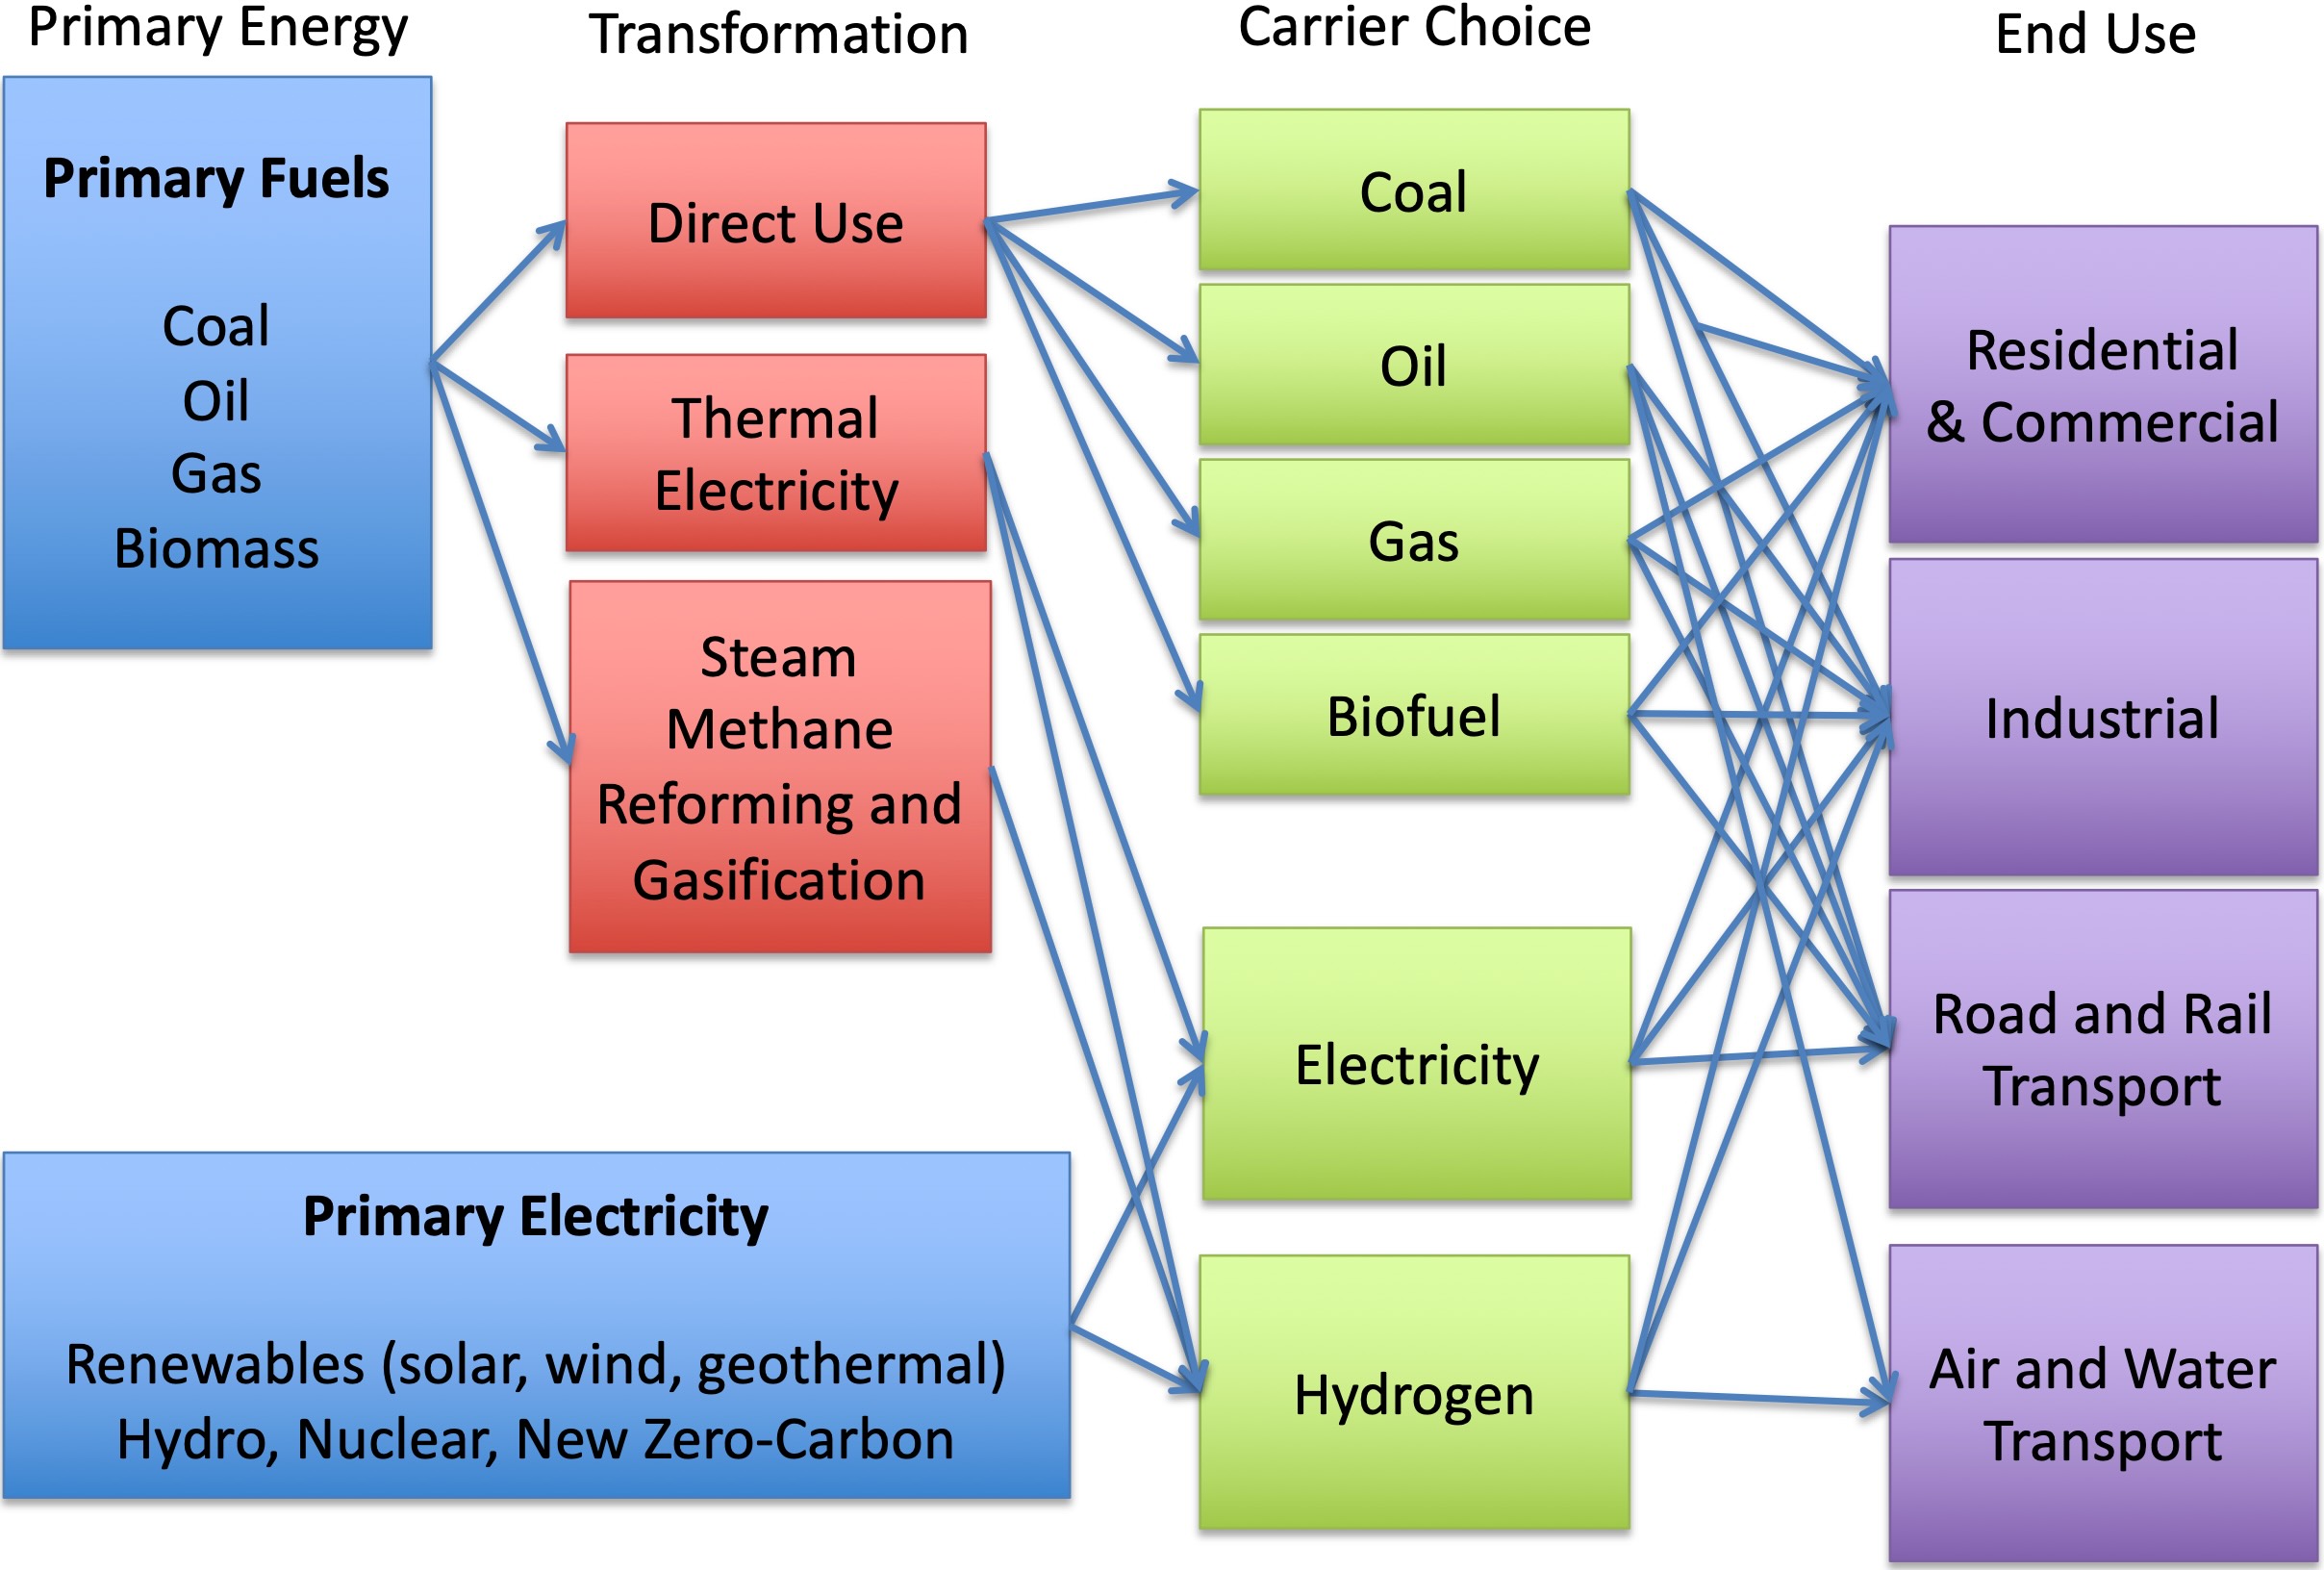
- Energy source choice
- Energy carrier choice
- Energy intensity
- Energy variable and capital costs
- Price, capacity, and utilization of fuels
- Price of electricity and capacity and utilization of each source
- Price of hydrogen and capacity and utilization of each source
- Energy technology (learning by doing)
- Nonrenewable resource depletion
- Renewable resource saturation
- Energy Storage
- Carbon capture and storage
- GHG & climate dynamics
- Agriculture and land use
- Sea level rise and other climate impacts
- GDP adjusted for climate impacts
- Excluded:
- Inventories
- Labor
The energy system is modeled in great detail, including price, technology and other factors that affect the dynamics of energy and emissions across the full lifecycle for all sources, including potential new technologies.
Organization🔗
En-ROADS is made up of several interconnected submodels which hold the equations. Model sectors are functional and may span one or many submodels. A particular variable is always calculated in only one submodel, but the results are passed to other submodels, and each variable may participate in many model sectors. The submodel listing below describes what sectors each contributes to. A more detailed description of equations and dynamics is organized by model sector in the chapters that follow.
- En-ROADS.mdl: Collects and organizes model output for testing, includes all sectors.
- Constants.mdl: Holds constants used across multiple sectors and submodels, such as unit conversions.
- Calibration.mdl: Provides interfaces and data connections for calibrating to historical data and comparing to other model projections under different scenarios.
- Population.mdl: User selected scenarios for population, part of the demand sector.
- GDP.mdl: User selected base economic growth, and slowed growth due to feedbacks, part of the demand sector.
- EnergyDemand.mdl: Desire for and choice between types of capital, and the use of capital. Part of the demand and market clearing and utilization sectors.
- EnergySupply.mdl: Investment, construction, use, and retirement of capacity in the energy sector, including fuel extraction and delivery and electricity generation. Part of the supply and market clearing and utilization sectors.
- EnergyCostsRevenues.mdl: Calculates cost dynamics of energy sources for learning, technology, and policies such as taxes and subsidies. Some cross-cutting energy technologies, such as efficiency and energy storage. Parts of demand, supply, and market clearing and utilization sectors.
- EnergyPricing.mdl: Adjusts prices to balance supply and demand, Part of the market clearing and utilization sector.
- Emissions.mdl: Calculates emissions from energy, end-use capital, and waste; and sums, accumulates and categorizes emissions. Emissions include CO2, CH4, N2O, and F-gases.
- CDR.mdl: Calculates the amount of carbon dioxide removal (CDR), afforestation, and carbon capture and storage (CCS) indicated by policy and price signals.
- BioenergyAgriculture.mdl: Calculates food needs, land and CH4 and N2O emissions for agriculture, and the costs and land needed for bioenergy materials. Parts of Land Use, Land Use Change, and Forestry; Terrestrial Biosphere; Emissions; Demand and Supply sectors.
- TerrestrialBiosphere.mdl: Tracks the land area, carbon content in biomass and soil, and the transfers of carbon between air, biomass, and soil for each category of land use.
- CarbonCycle.mdl: Sums the carbon transfers from TerrestrialBiosphere.mdl, and tracks the stocks and flows of carbon and other greenhouse gases between emissions, removals, atmosphere, and oceans.
- Climate.mdl: Calculates radiative forcing, heat flows, and temperature changes in the atmosphere and oceans.
- ClimateImpacts.mdl: Calculates those impacts that depend directly on temperature, or use temperature change as a proxy for climate change impacts.
- PM25.mdl: Calculates pollution other than greenhouse gases produced from burning fuels.
- OceanSystems.mdl: Detailed components of the ocean: heat and carbon flows between layers; thermal expansion, water flows, and ice melt leading to sea level changes; and acidification effects of dissolved CO2.
In the model structure diagrams in the following chapters, there are four types of elements:
- Variables with a box represent stocks, determined by integration.
- Variables without a box are auxiliary variables.
- Simple arrows indicate a causal relationship, one variable is a function of the other.
- Pipes represent flows - the elements of the rate of change of stocks - shown flowing into, out of, and between stocks.