Sammenligne modeller - historisk🔗
Table of Contents🔗
- Primary Energy Demand History
- Final Energy Consumption History
- Electricity Generated by Energy Source History
- Marginal Cost of Wind, Solar, and Geothermal Electricity History
- Emissions History
- Atmospheric Concentrations History
- Radiative Forcing History
- Temperature History
The purpose of this section of the En-ROADS User Guide is to supplement the historical comparison graphs in the En-ROADS application by sharing multiple comparisons of En-ROADS model behavior compared against measured historical data.
En-ROADS uses historical data for two purposes: initialization of the simulation and calibration. Certain variables in En-ROADS are initialized with their measured historical values from 1990, and then the model runs. We compare the model output from 1990 through present day to measured historical data to identify opportunities for model improvement.
The graphs below compare the En-ROADS Baseline Scenario to measured historical data for select variables. Not all variables and comparisons to history are included here. The historical data are derived from the following sources:
- Global Carbon Project: Friedlingstein, P., et al. (2022). Global carbon budget 2022. Earth System Science Data, 14, 4811–4900. [CO2 energy emissions only]
- IEA. (2020a). Evolution of solar PV module cost by data source, 1970-2020.
- IEA. (2020b). Global average LCOEs and auction results for utility-scale PV by commissioning date.
- IEA WEO: IEA. (2022). World Energy Outlook 2022.
- IEA World Energy Statistics & Balances: IEA. (2022). World Energy Statistics & Balances.
- IRENA. (2020). Renewable Power Generation Costs in 2019.
- Lazard. (2021). Lazard's Levelized Cost of Energy Analysis - Version 15.0.
- LUH2: Hurtt, G. C., et al. (2020). Harmonization of global land-use change and management for the period 850-2100 (LUH2) for CMIP6. Geoscientific Model Development, 13(11), 5425–5464.
- Met Office Hadley Centre HadCRUT5: Morice, C. P., et al. (2022). An updated assessment of near-surface temperature change from 1850: the HadCRUT5 dataset. Journal of Geophysical Research: Atmospheres, 126, e2019JD032361. Data available at https://www.metoffice.gov.uk/hadobs/hadcrut5/data/current/download.html.
- NASA GISS. (2022). GISS Surface Temperature Analysis (GISTEMP), version 4. NASA Goddard Institute for Space Studies.
- NOAA AGGI: NOAA. (2022). Annual Greenhouse Gas Index.
- NOAA ESRL: NOAA. (2022). Trends in Atmospheric Carbon Dioxide.
- PRIMAP: Gütschow, J., Günther, A., & Pflüger, M. (2021). The PRIMAP-hist national historical emissions time series (1850-2018). v2.3.1. [Non-CO2 greenhouse gas emissions only]
Five historical comparison graphs are also included in the En-ROADS app under Graphs > Model Comparison—Historical and are included and disaggregated here:
- Greenhouse Gas Net Emissions History
- Primary Energy Demand of Coal, Oil, and Gas History
- Primary Energy Demand of Wind and Solar History
- Marginal Cost of Solar Electricity History
- Temperature History
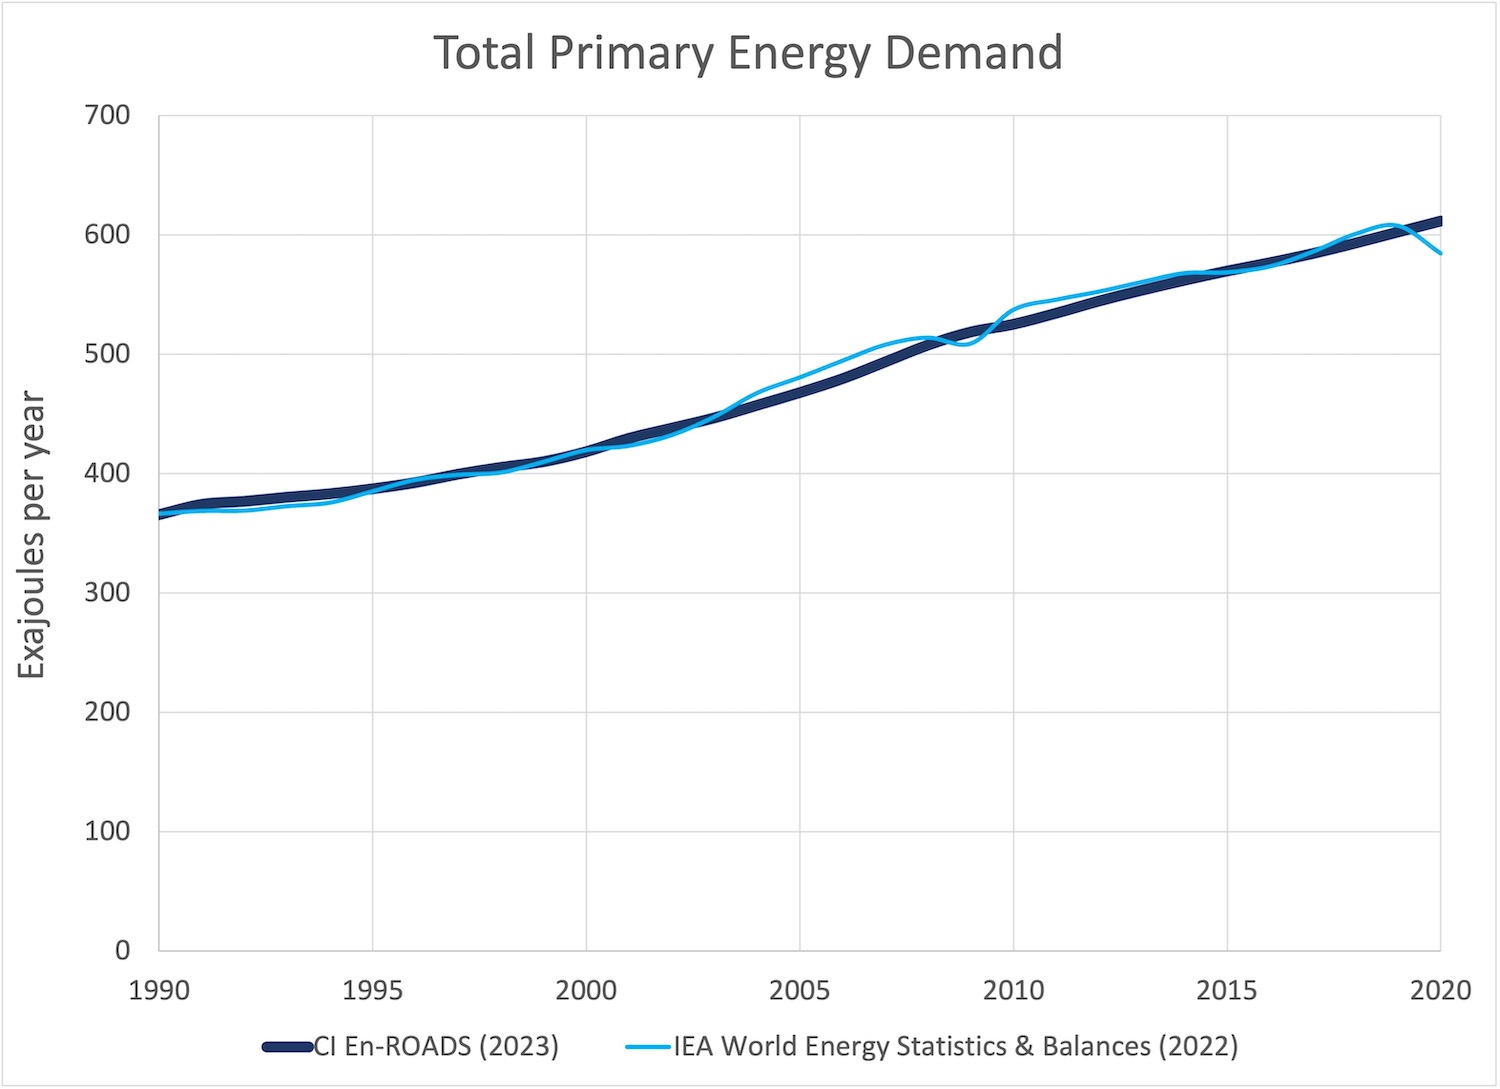
Primary Energy Demand History🔗
- Total Primary Energy Demand
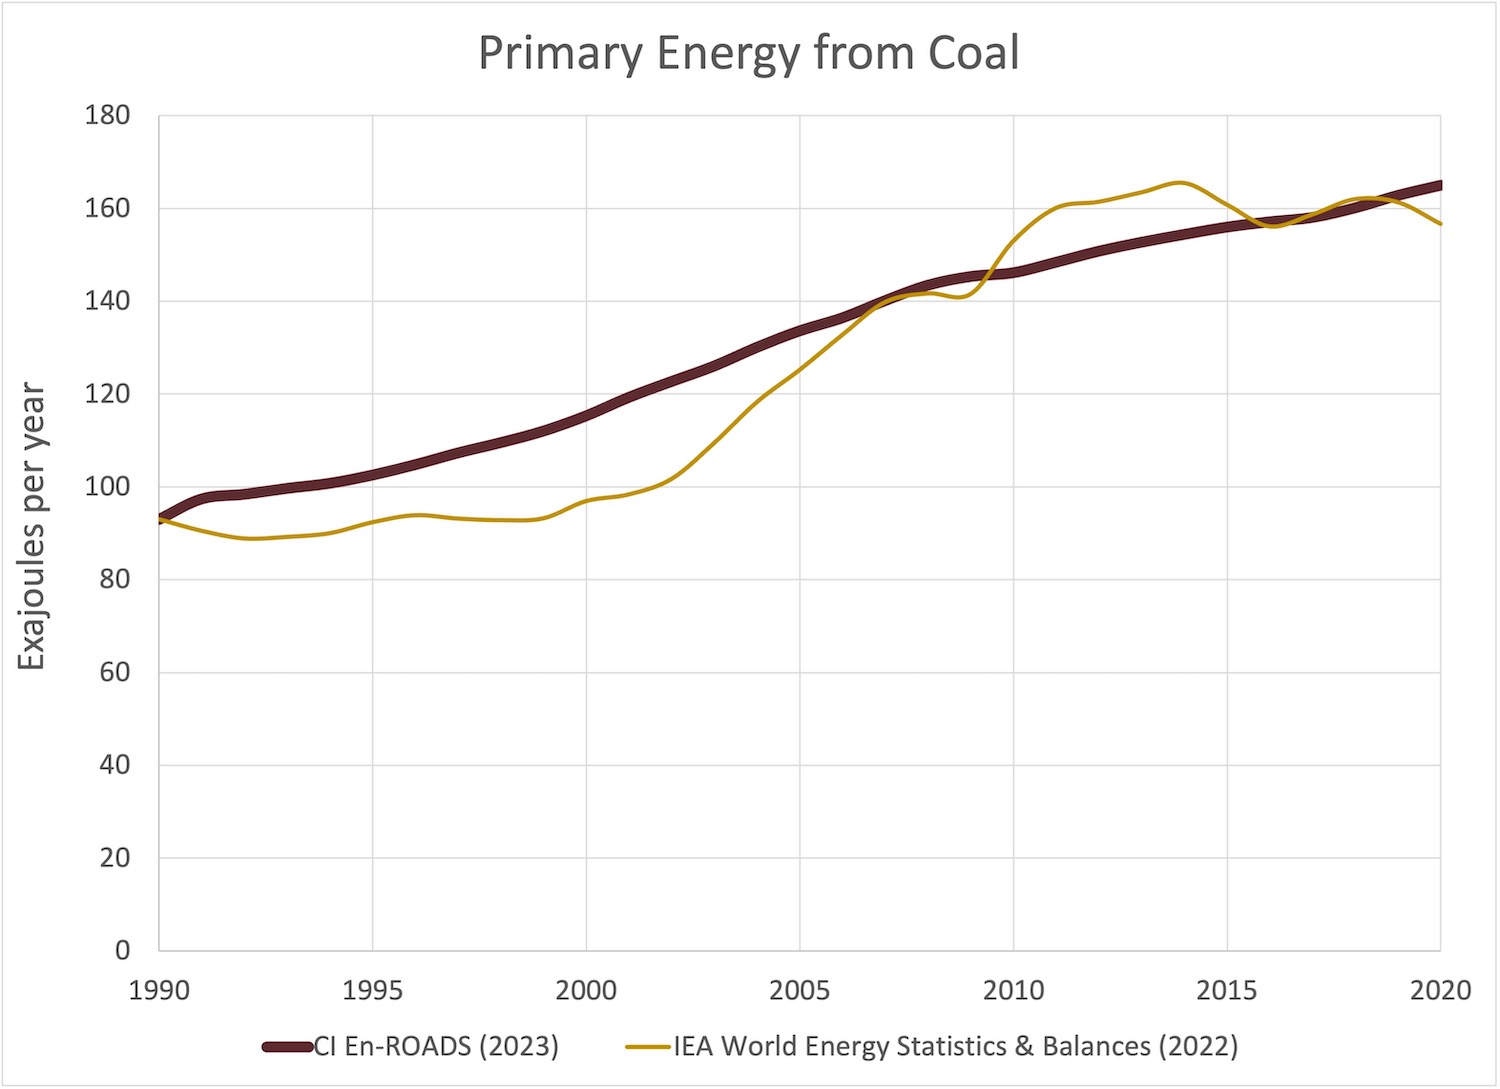
- Primary Energy from Coal
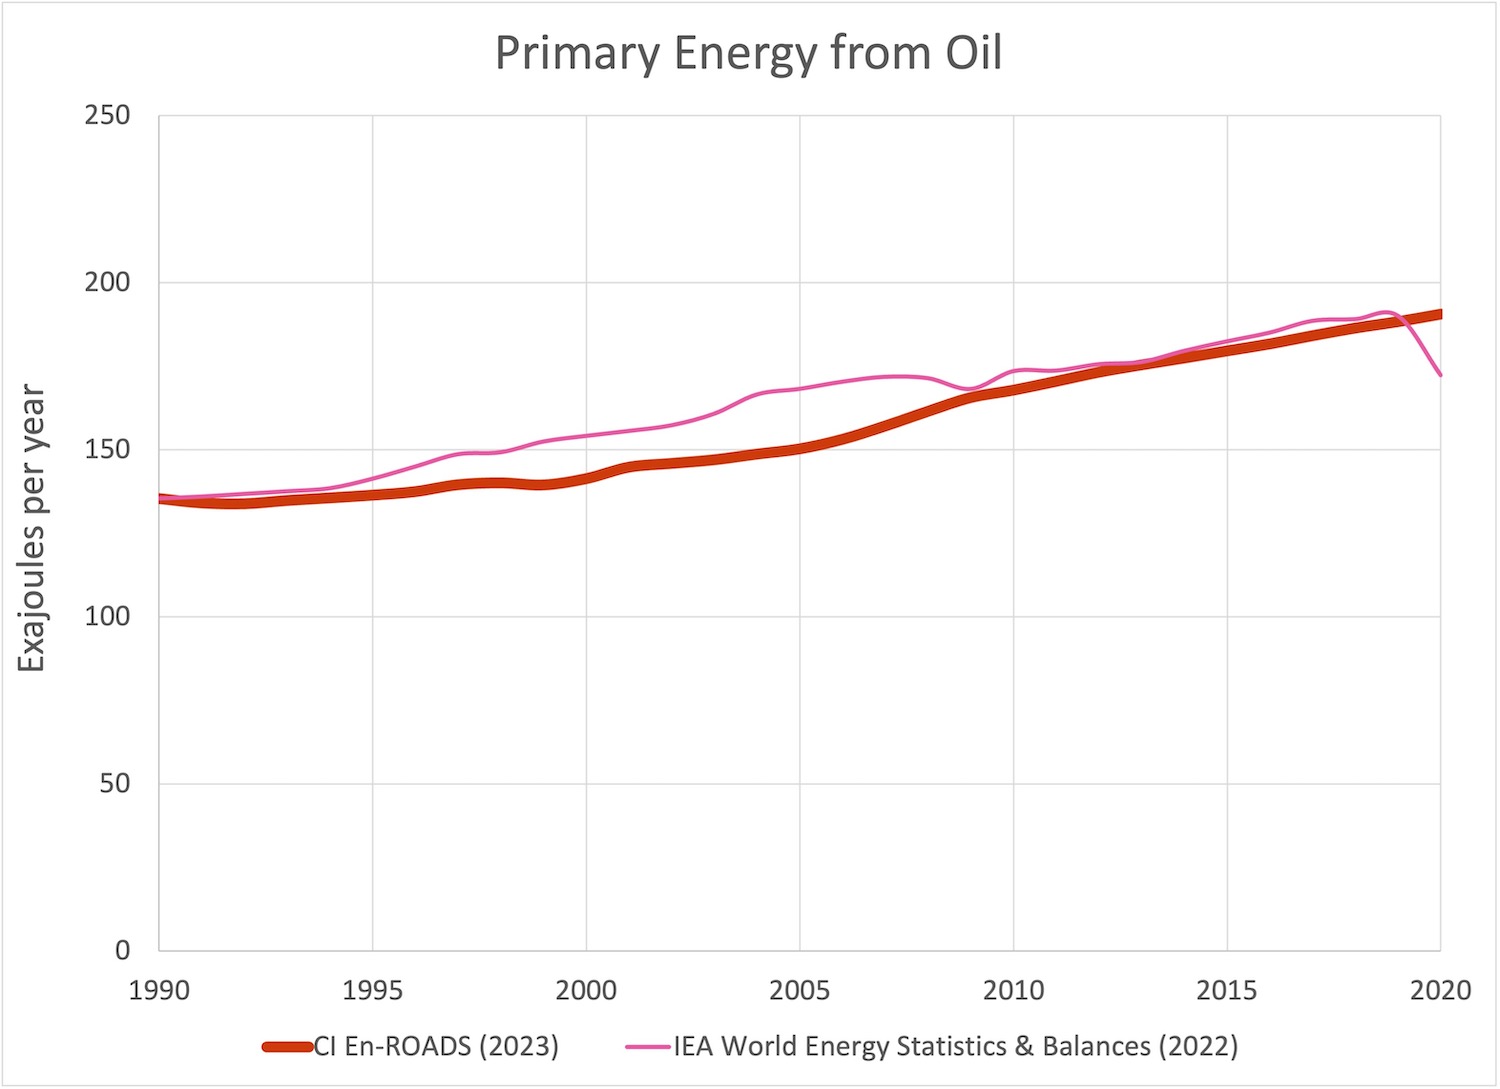
- Primary Energy from Oil
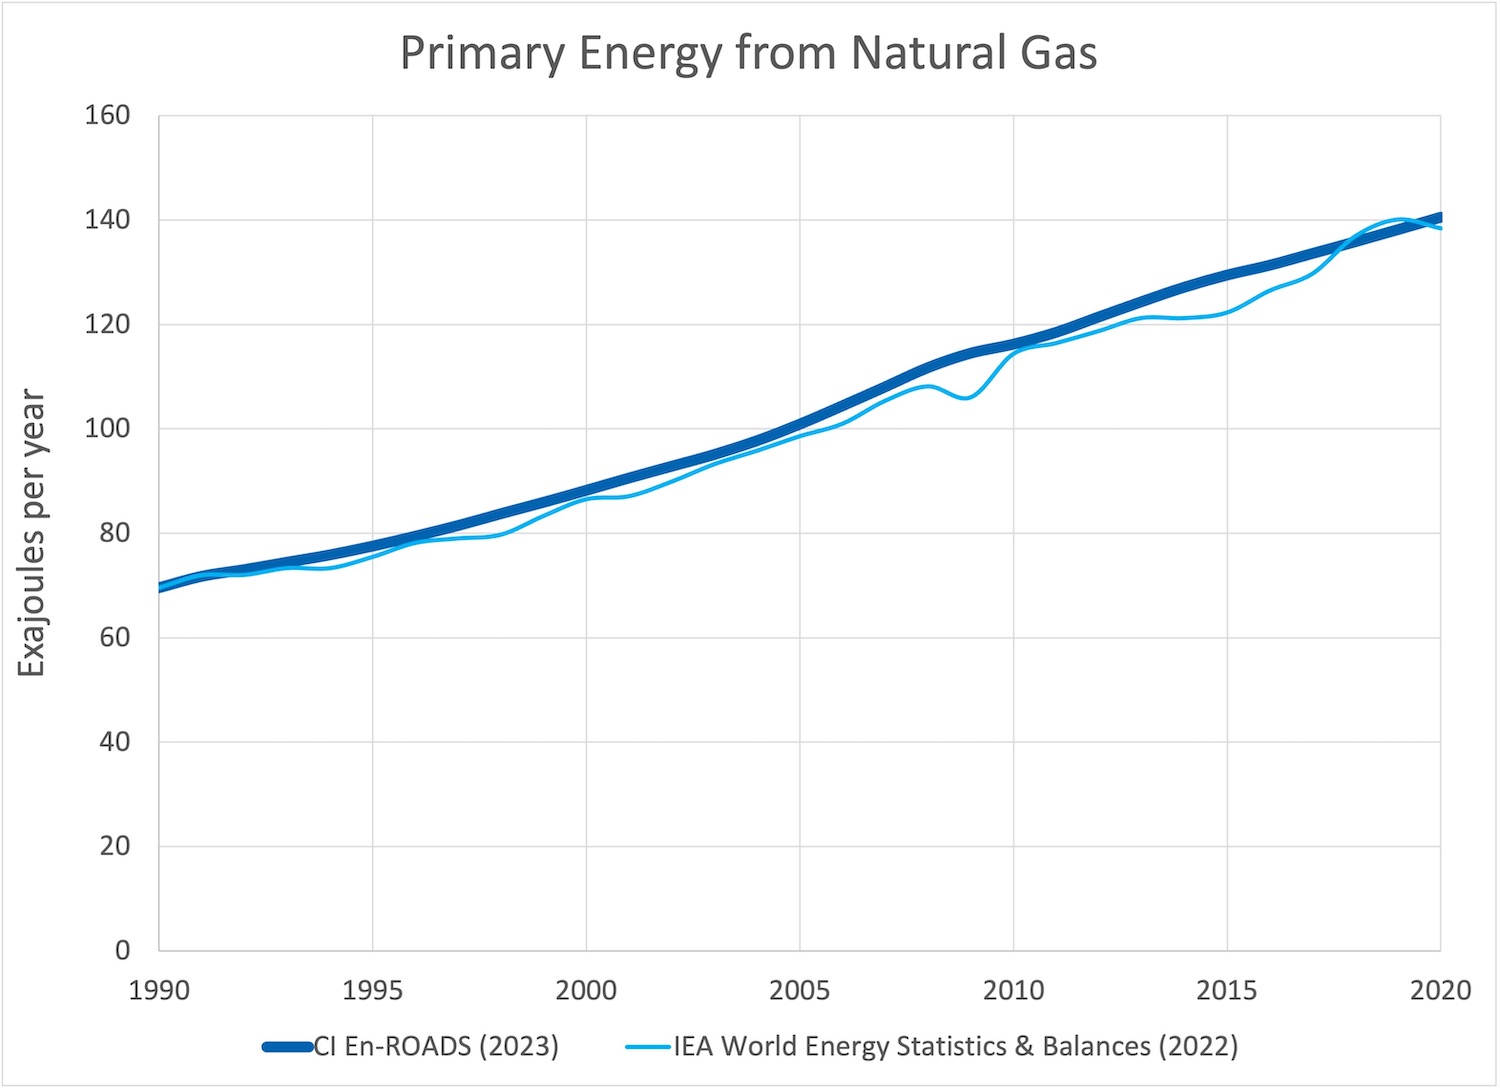
- Primary Energy from Natural Gas
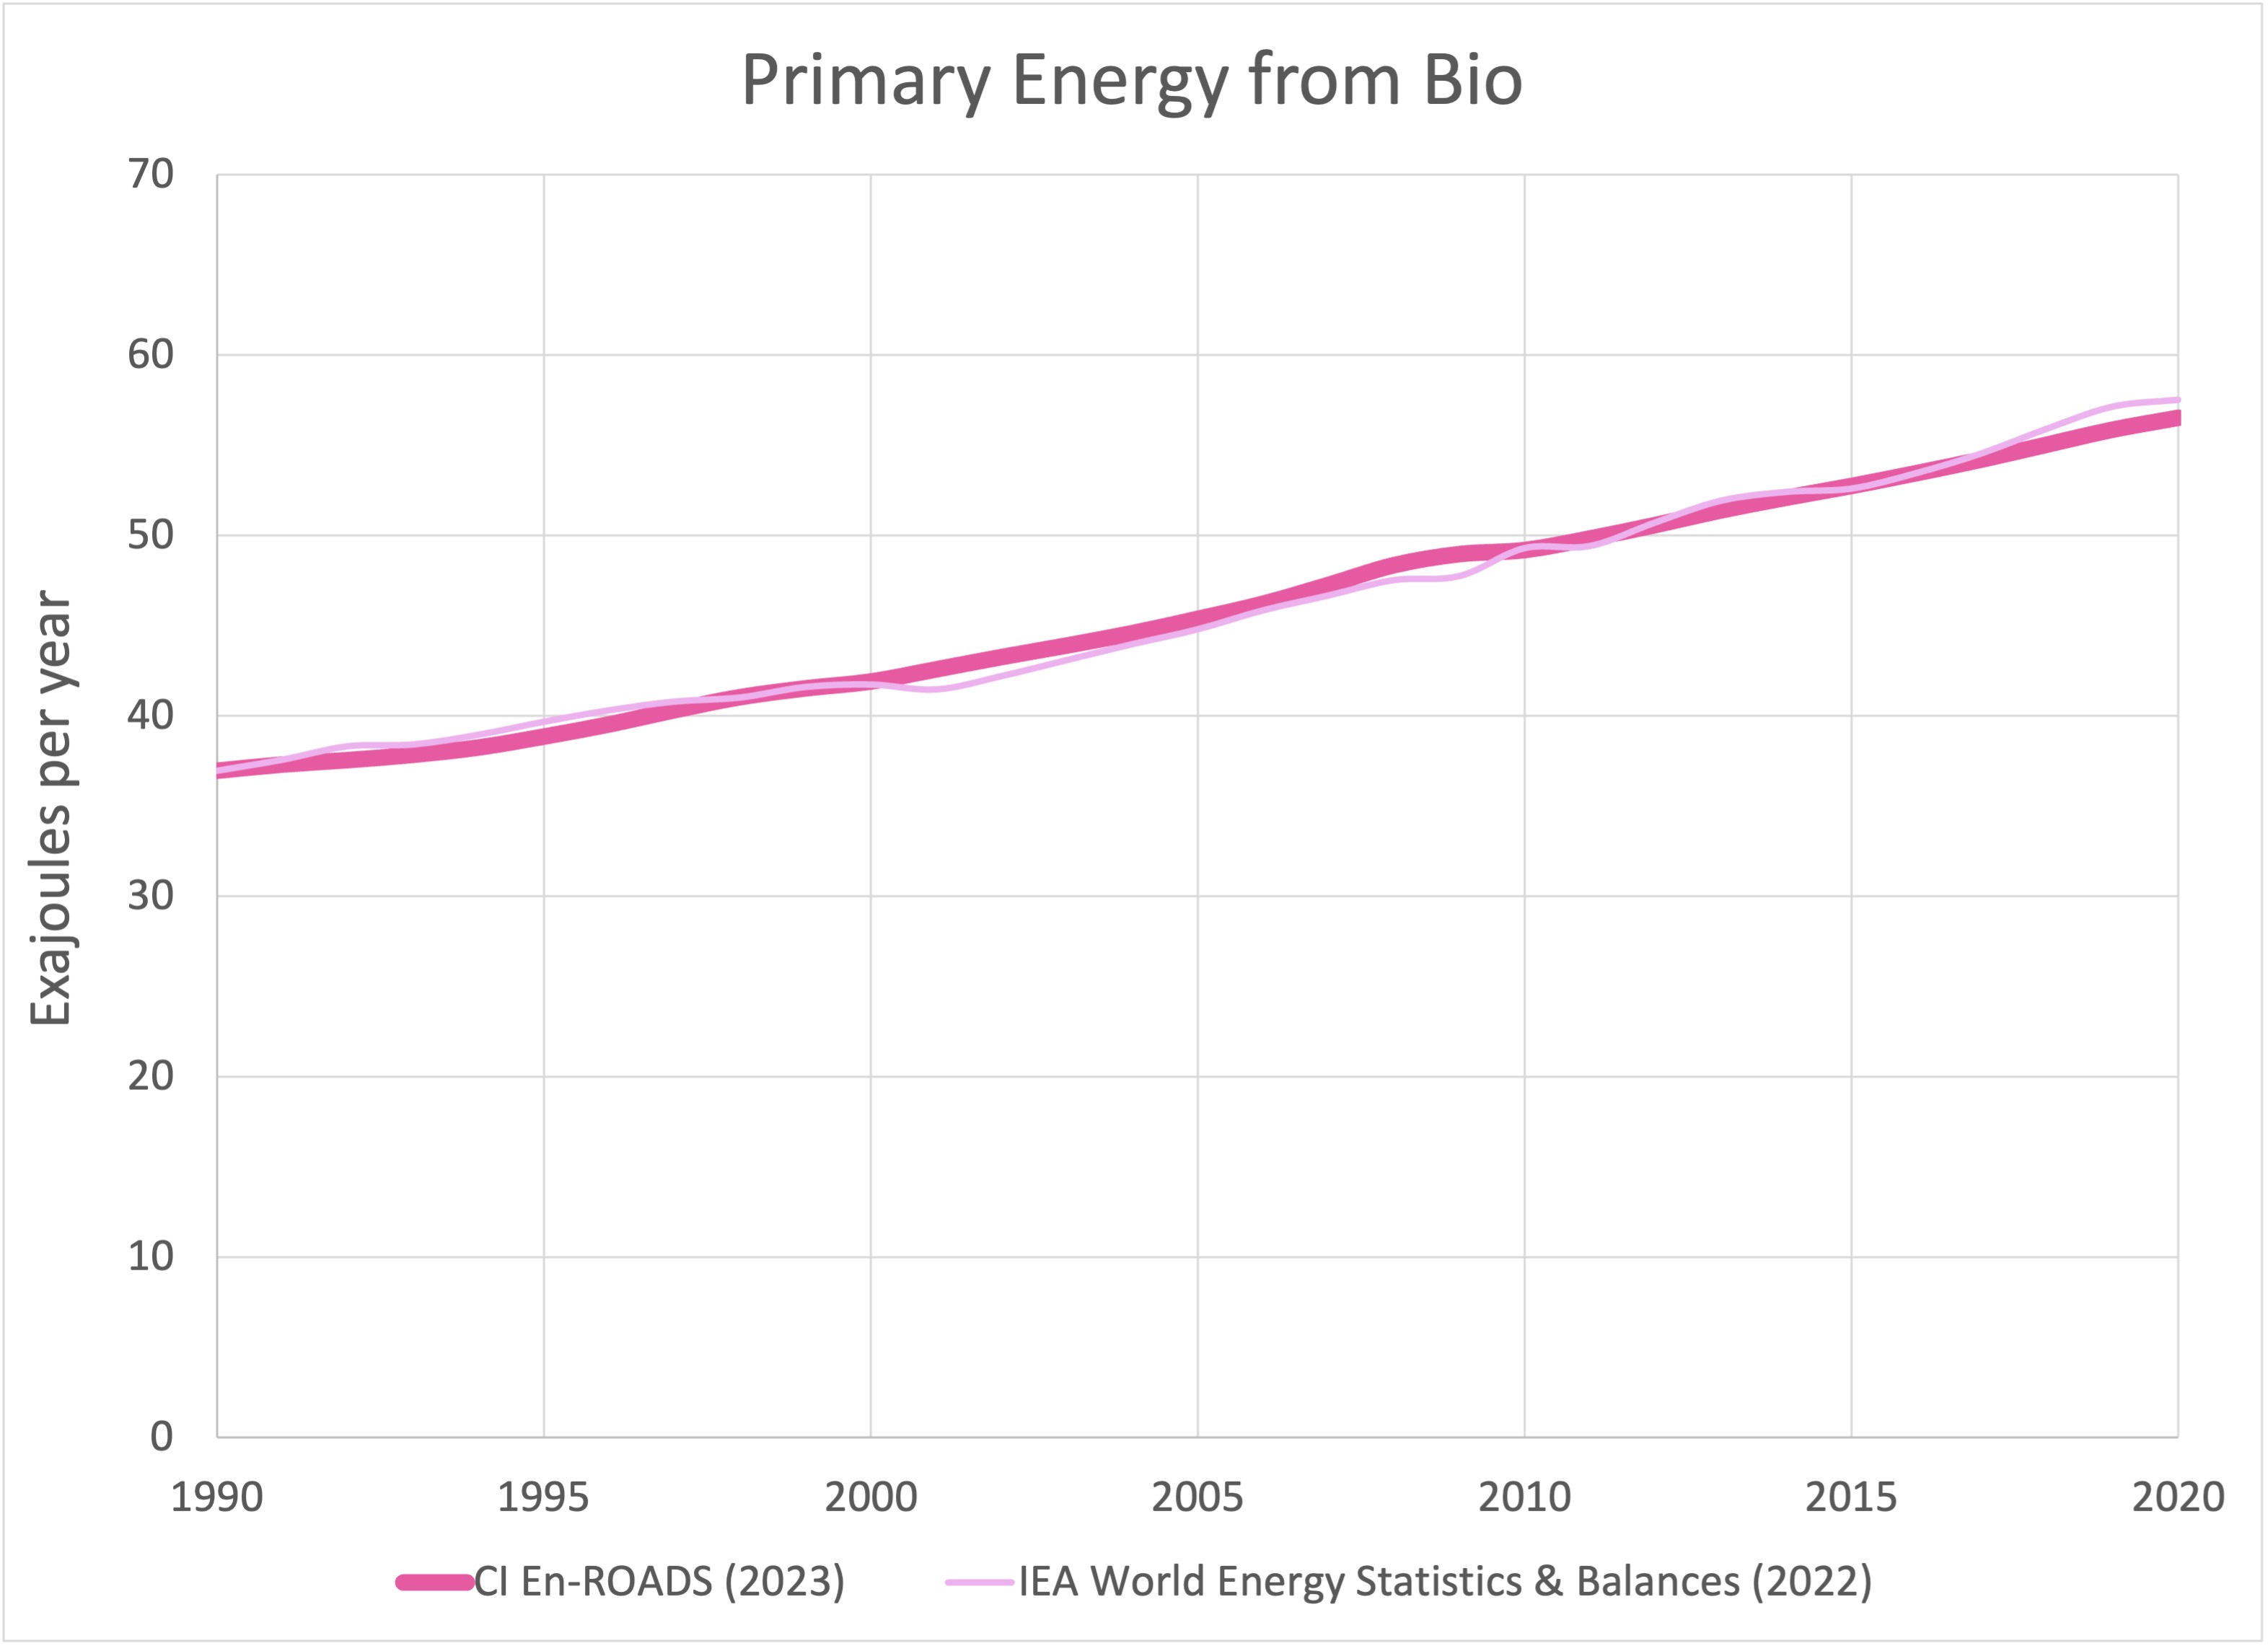
- Primary Energy from Bioenergy
- Primary Energy from Nuclear
Global primary energy demand of energy sources for the En-ROADS Baseline Scenario compared to IEA historical data. This is measured in exajoules per year (joules x 1018/year) for electric and nonelectric sources combined.
Primary energy refers to the total energy from a raw energy source that is converted into consumable energy. For example, primary coal energy demand refers to the total energy in coal that is mined, processed, and consumed. Primary energy is greater than final energy consumption because it accounts for inefficiencies in fuel processing, thermal conversion, and transmission and distribution (T&D).
Statistical fit🔗
Click here for descriptive statistics of En-ROADS fit to historical data.
Sources of historical data🔗
- IEA World Energy Statistics & Balances: IEA. (2022). World Energy Statistics & Balances.
Total Primary Energy Demand🔗
Primary Energy from Coal🔗
Primary Energy from Oil🔗
Primary Energy from Natural Gas🔗
Primary Energy from Bioenergy🔗
Primary Energy from Nuclear🔗
En-ROADS, as well as many other sources, assumes that nuclear energy has an efficiency of 100% conversion of primary energy into electricity generated. Some sources, like the IEA WEO, assume that the primary energy equivalent from the electricity generation has an efficiency of 33%. To compare En-ROADS output to the IEA WEO, we multiply the primary energy in En-ROADS by 3.
![]()
Final Energy Consumption History🔗
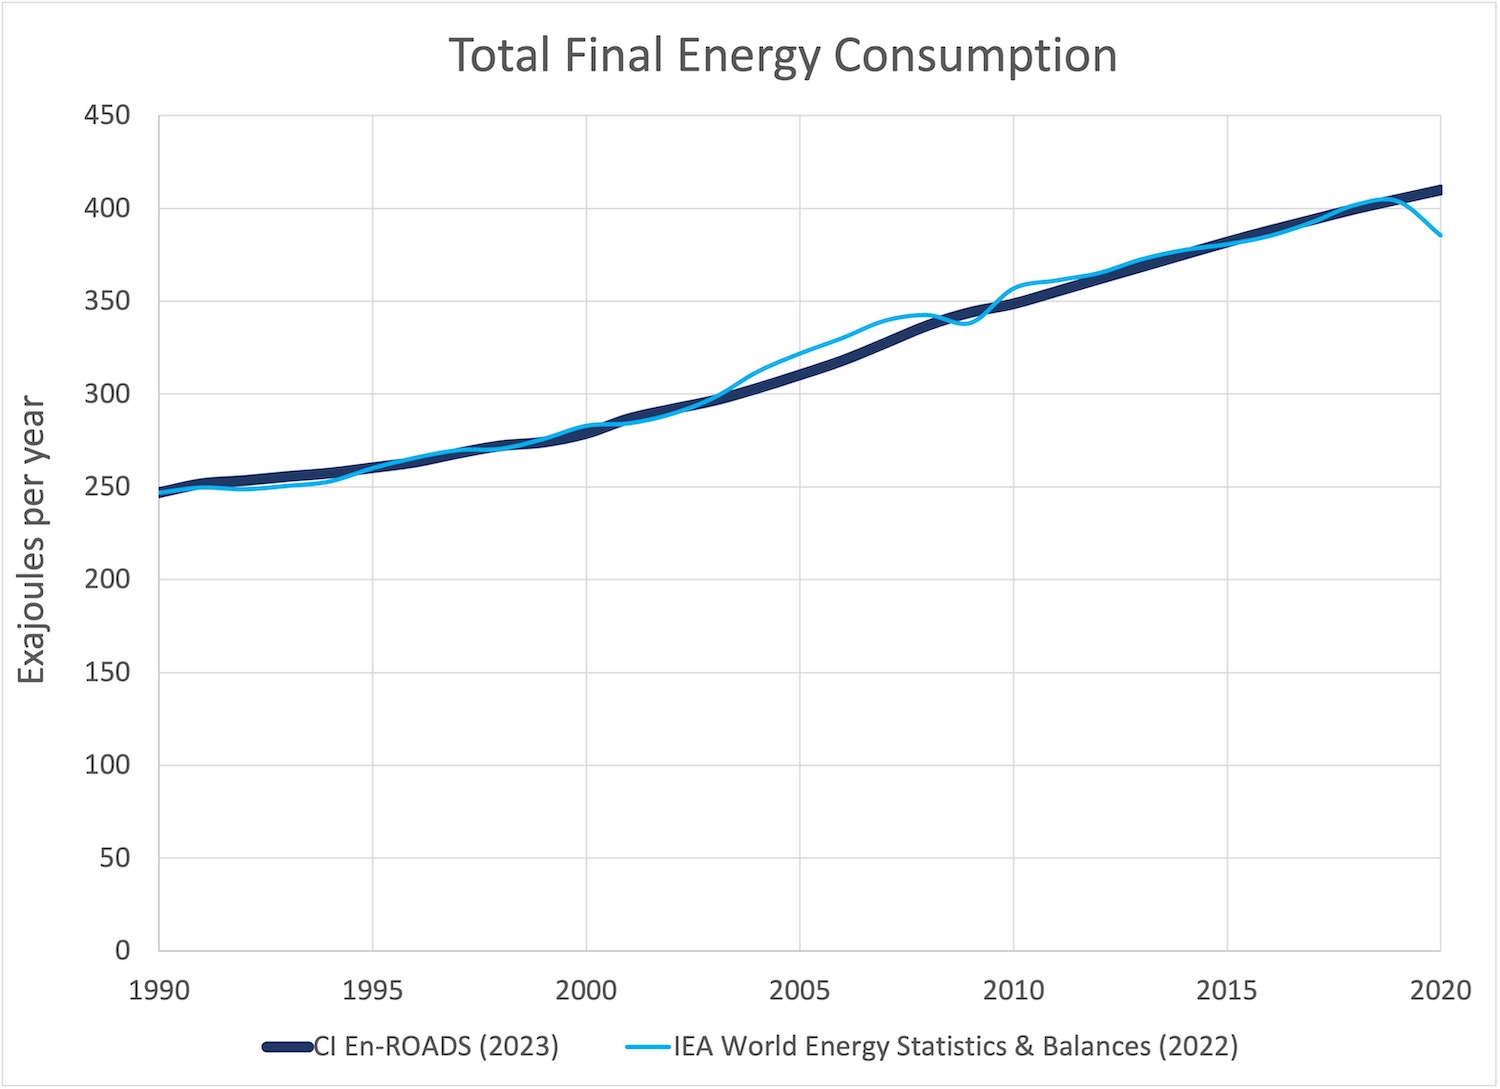
- Total Final Energy Consumption
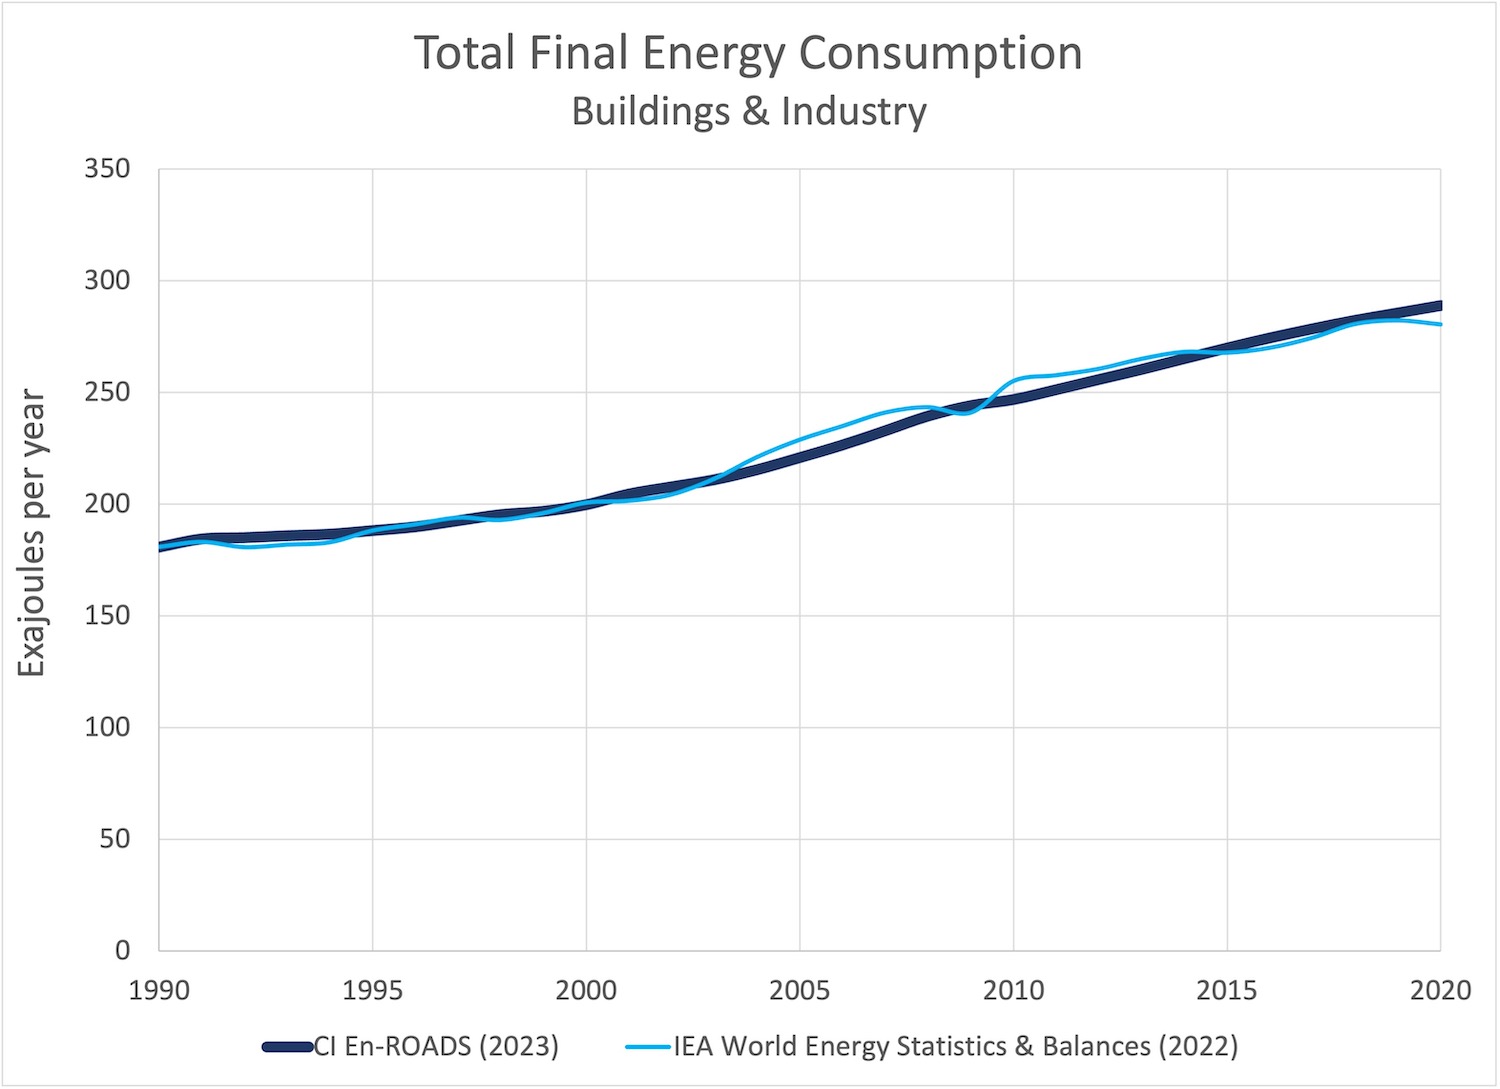
- Total Final Energy Consumption - Buildings & Industry
- Total Final Energy Consumption - Transport
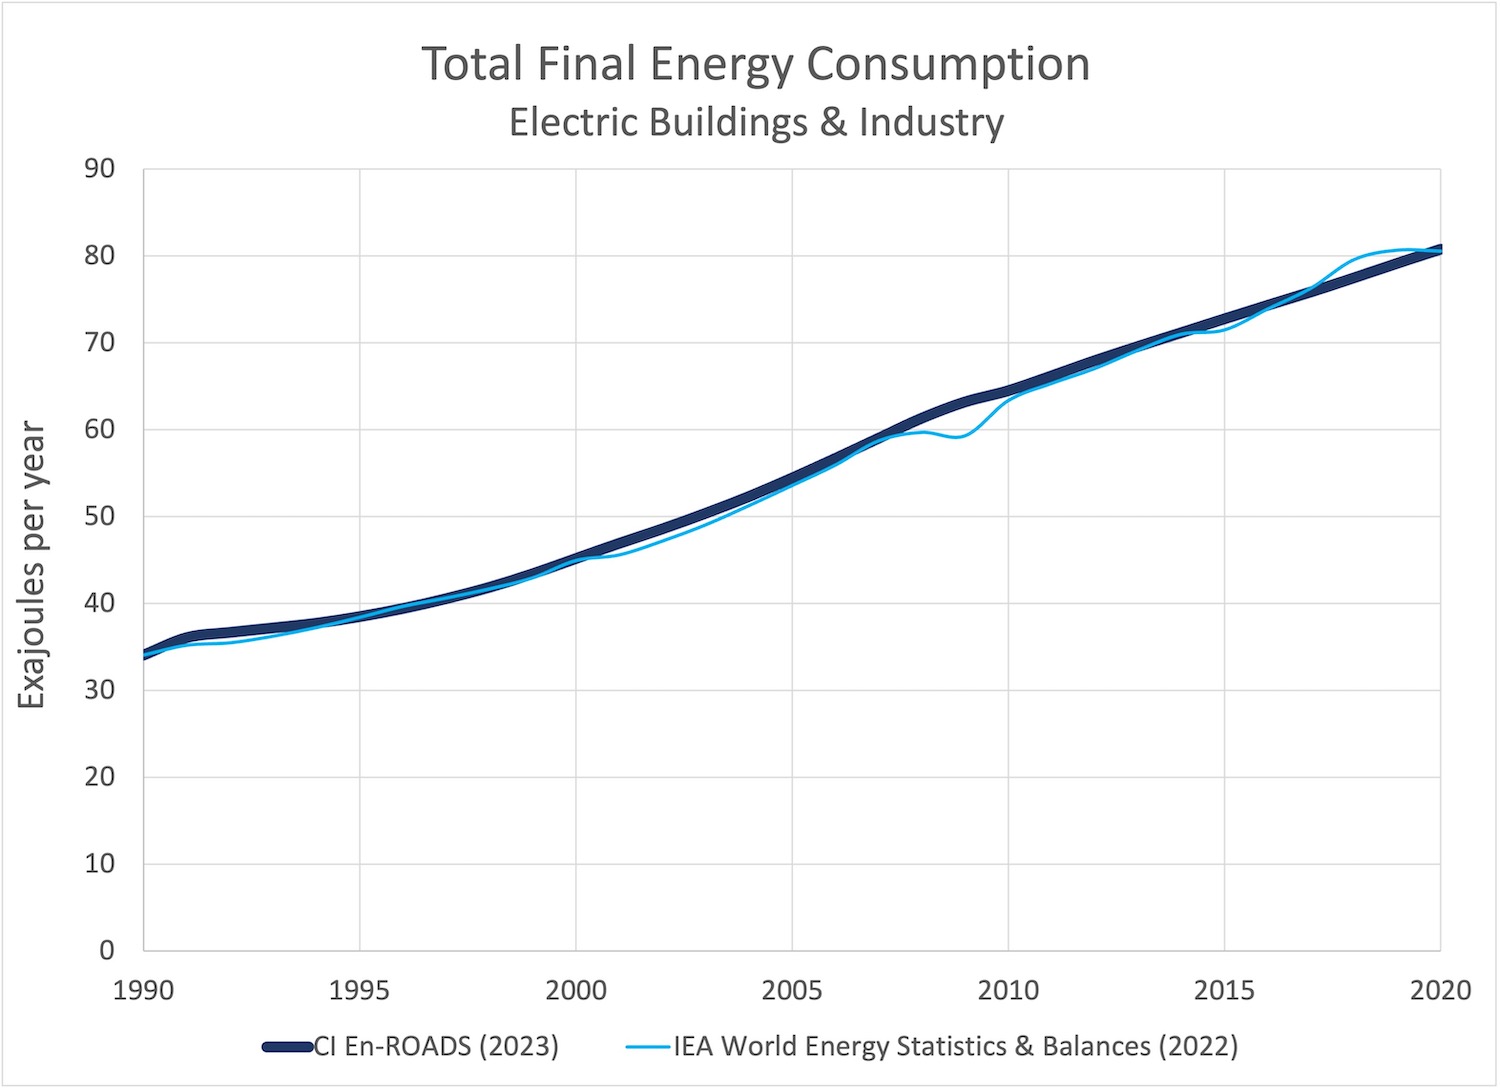
- Total Final Energy Consumption - Electric Buildings & Industry
- Total Final Energy Consumption - Electric Transport
Global total final energy consumption of energy sources in exajoules/year (joules x 1018/year) for electric and nonelectric sources combined in the En-ROADS Baseline Scenario compared to historical data.
Final consumption refers to the total energy consumed to meet the demand of all final energy uses plus the use of feedstocks for products like plastics. For example, how much electricity a lightbulb uses or how much fuel a truck burns are measures of final energy consumption. It does not include energy lost through transmission and distribution (T&D) or inefficiencies, which, in contrast, is accounted for in primary energy.
Final energy consumption is divided into two end uses: stationary (buildings and industry) and transport.
Statistical fit🔗
Click here for descriptive statistics of En-ROADS fit to historical data.
Sources of historical data🔗
- IEA World Energy Statistics & Balances: IEA. (2022). World Energy Statistics & Balances.
Total Final Energy Consumption🔗
Total Final Energy Consumption – Buildings & Industry🔗
Total Final Energy Consumption – Transport🔗
![]()
Total Final Energy Consumption – Electric Buildings & Industry🔗
Total Final Energy Consumption – Electric Transport🔗
![]()
Electricity Generated by Energy Source History🔗
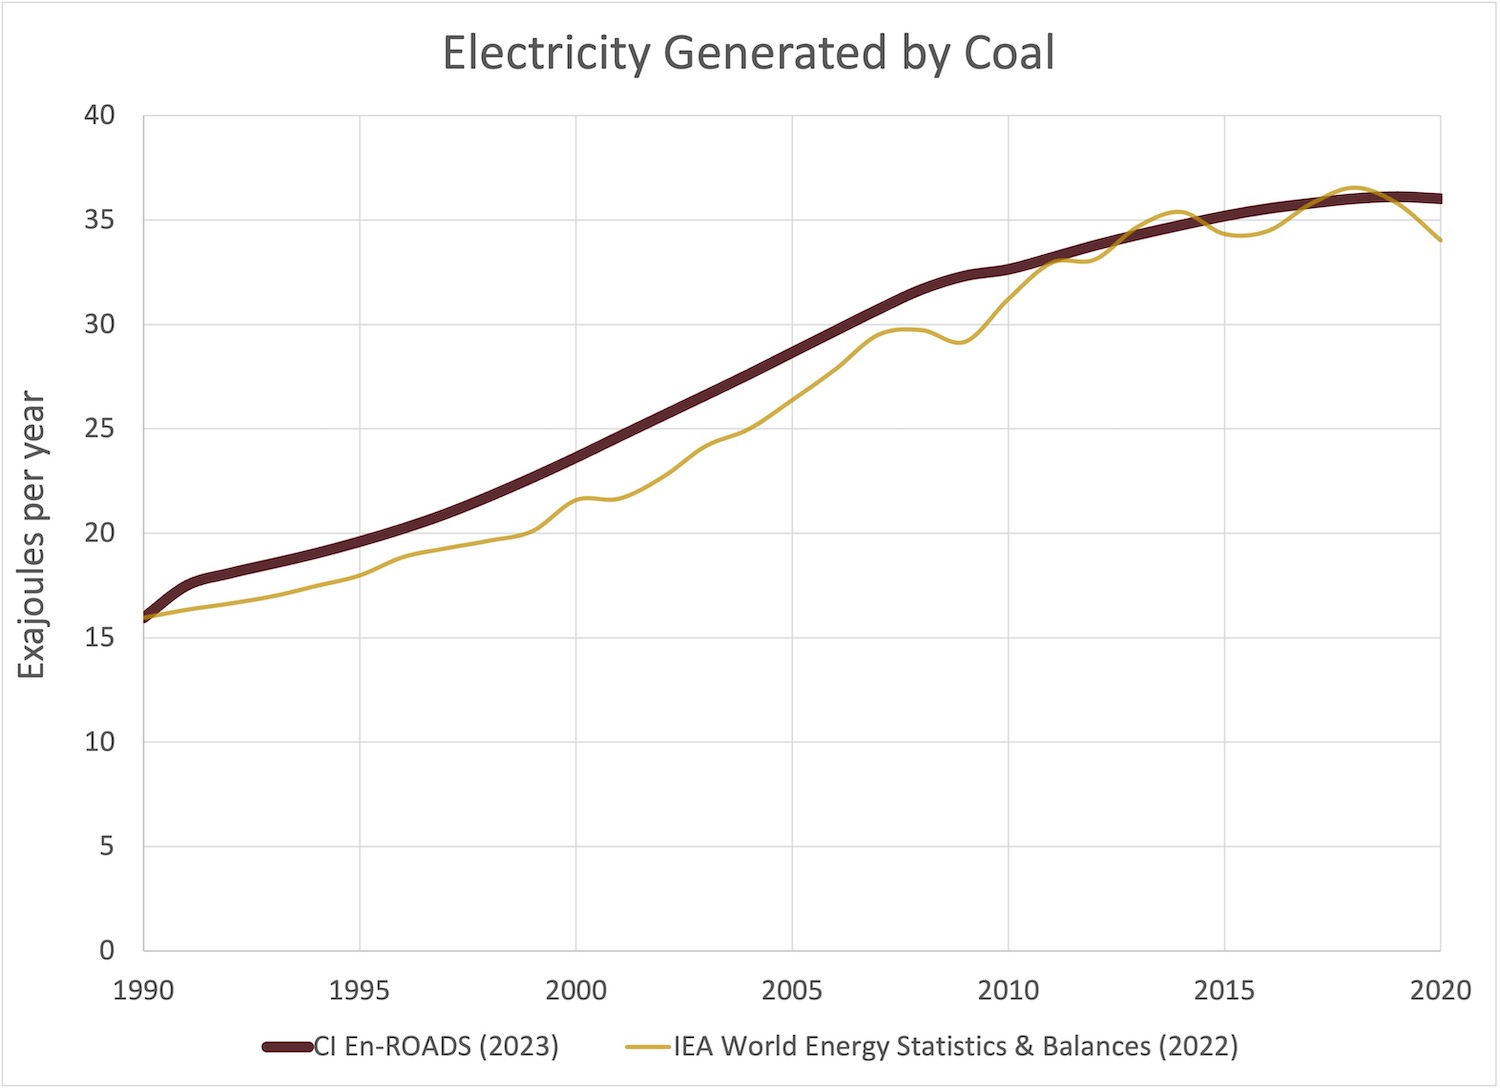
- Electricity Generated by Coal
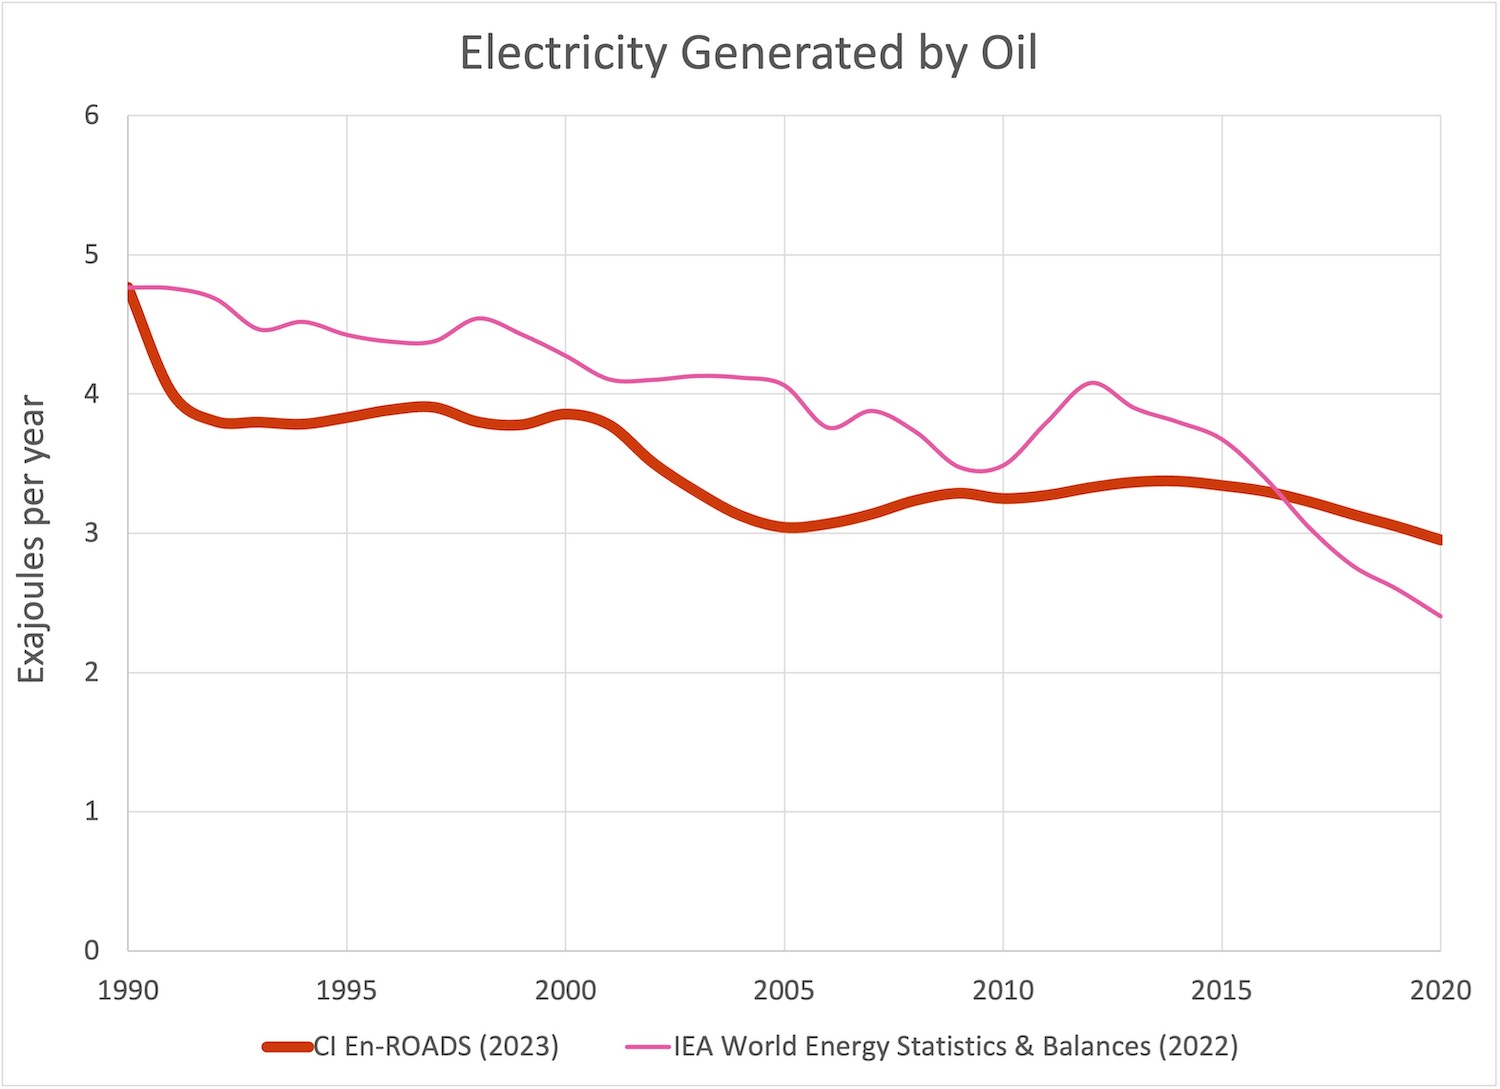
- Electricity Generated by Oil
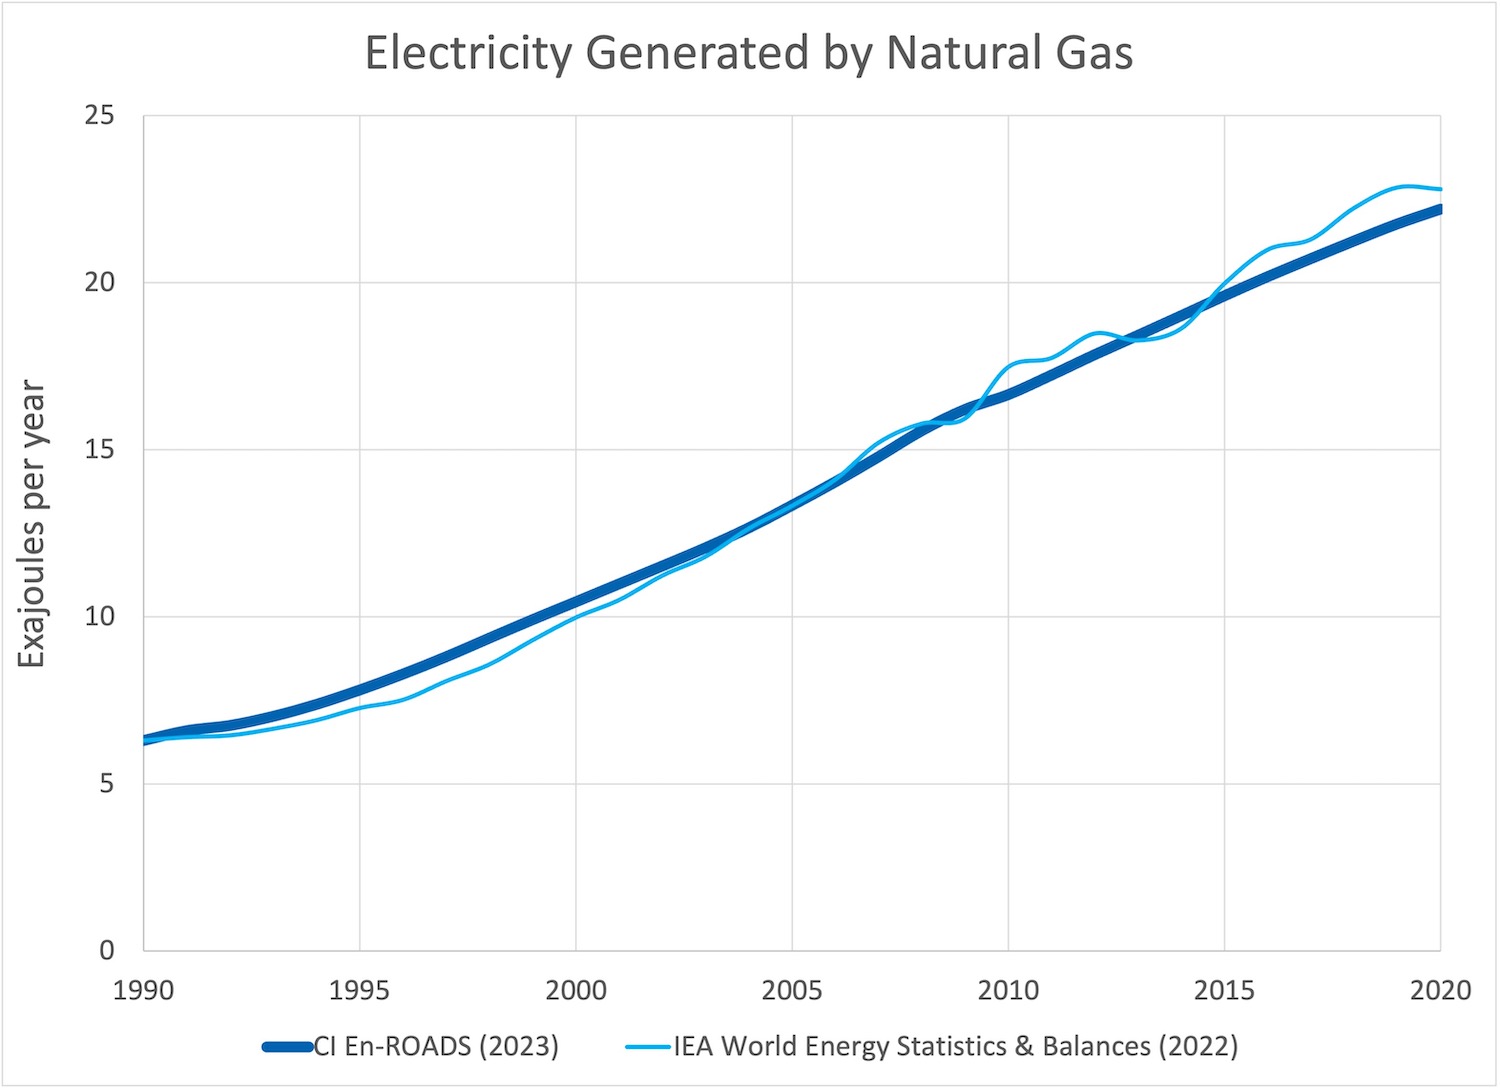
- Electricity Generated by Natural Gas
- Electricity Generated by Nuclear
- Electricity Generated by Bioenergy
- Electricity Generated by Hydro
- Electricity Generated by Solar
- Electricity Generated by Wind
- Electricity Generated by Geothermal
- Electricity Generated by Other Renewables
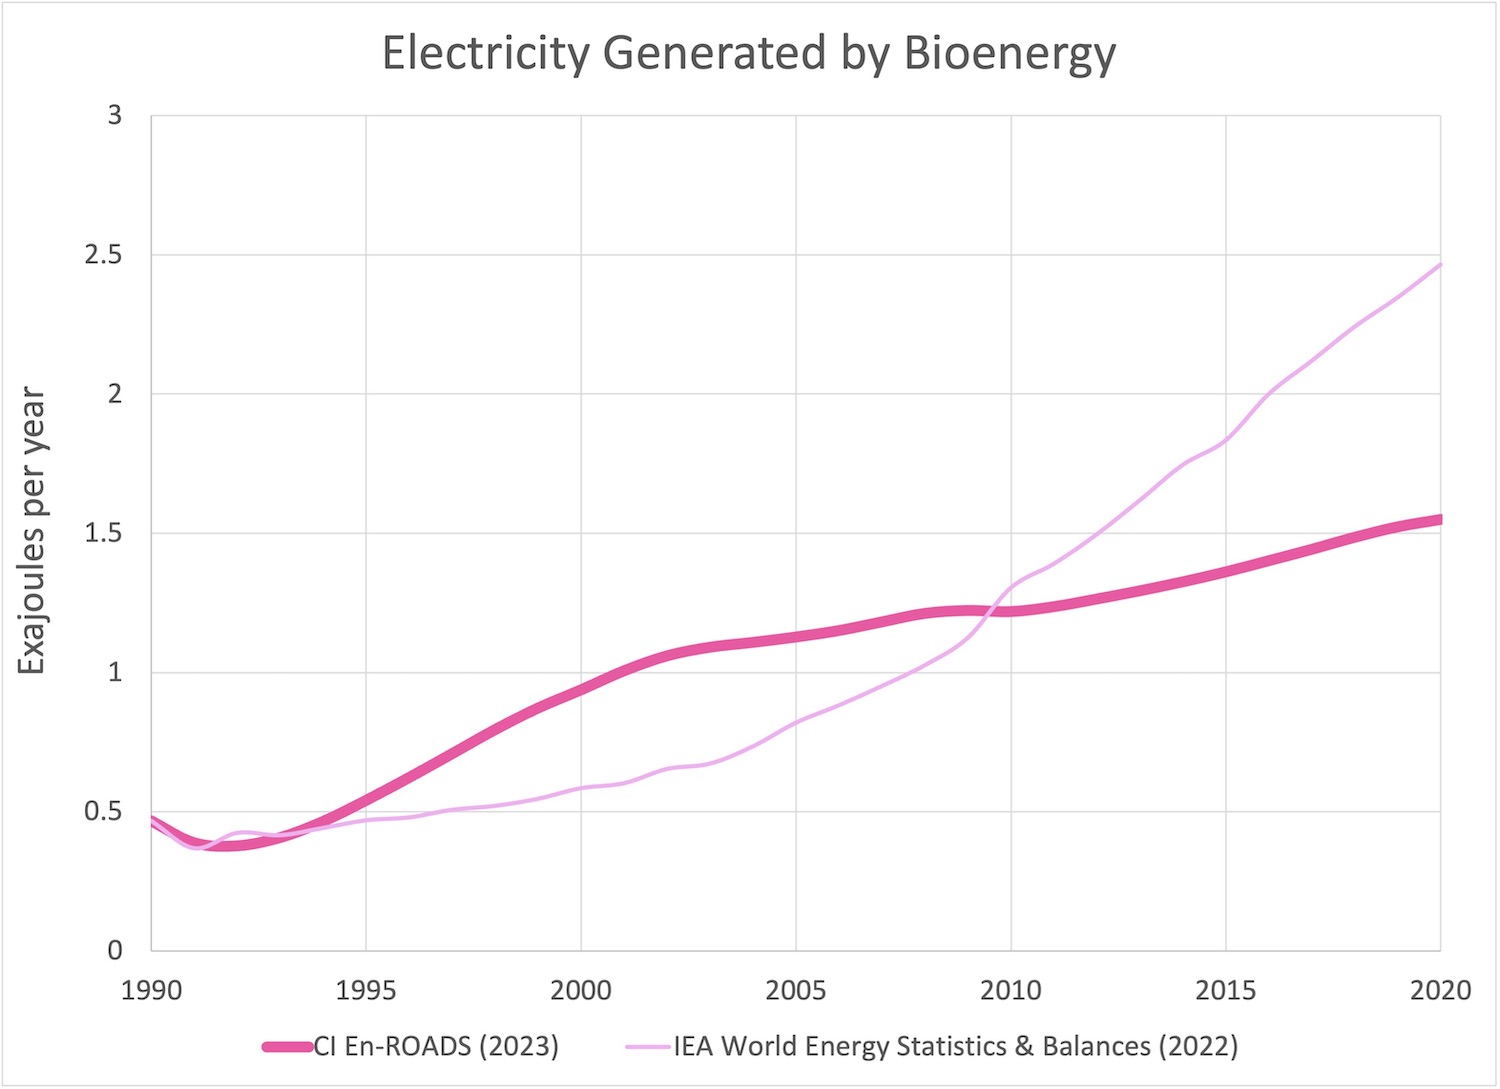
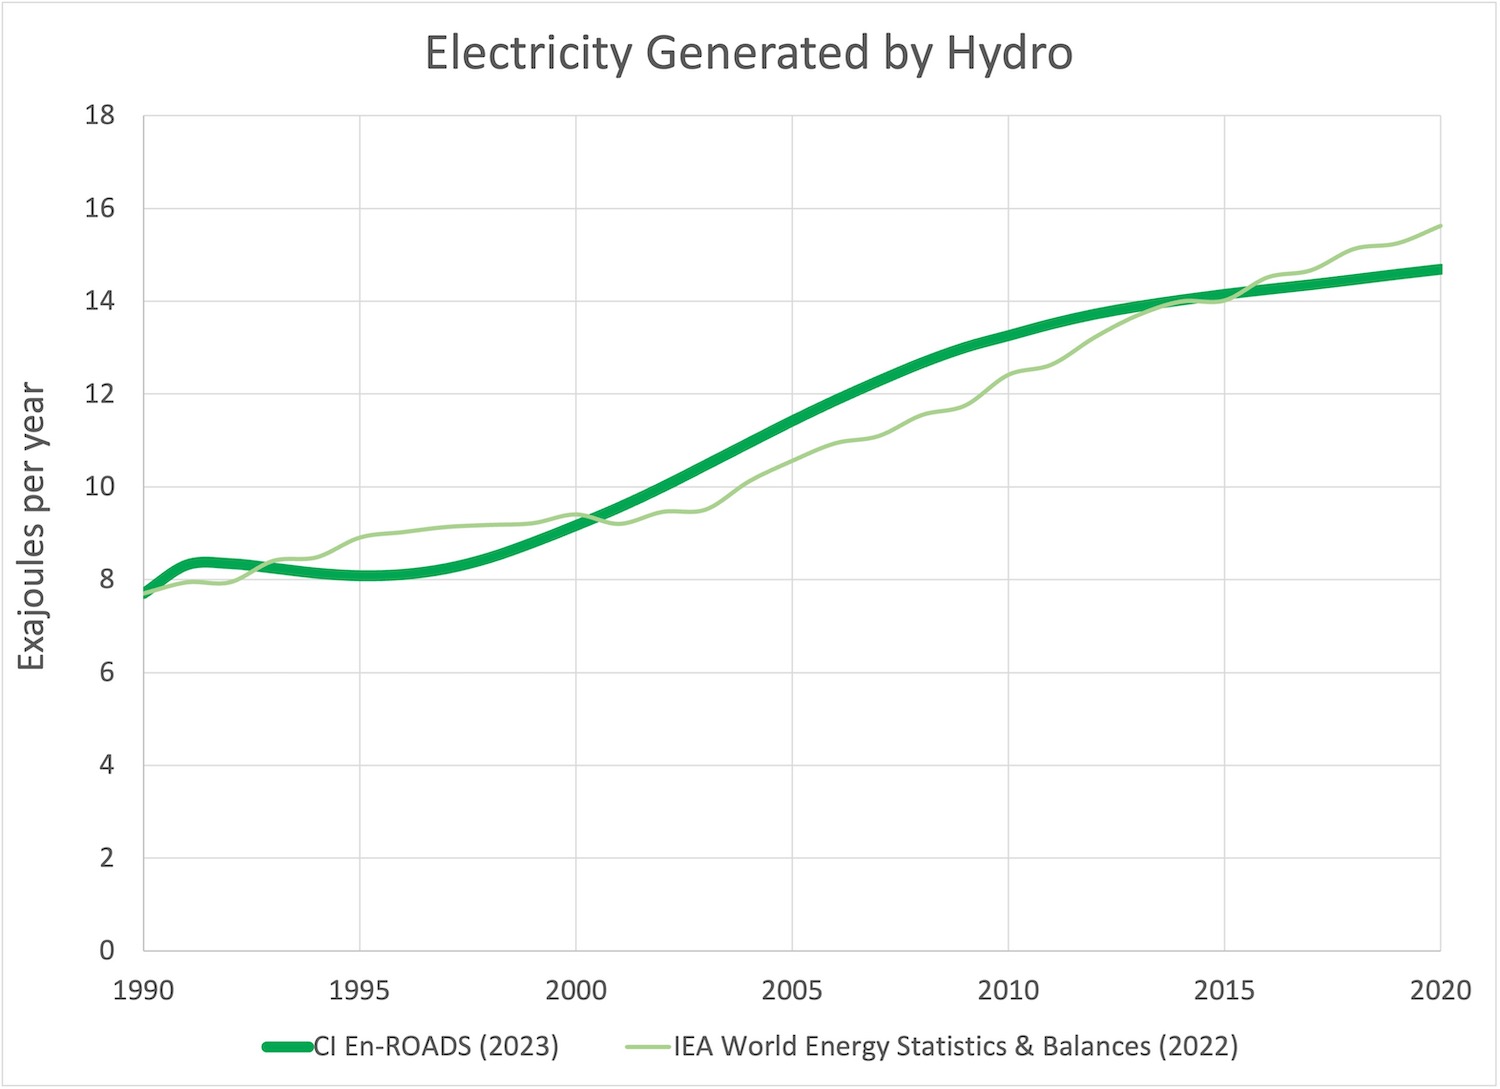
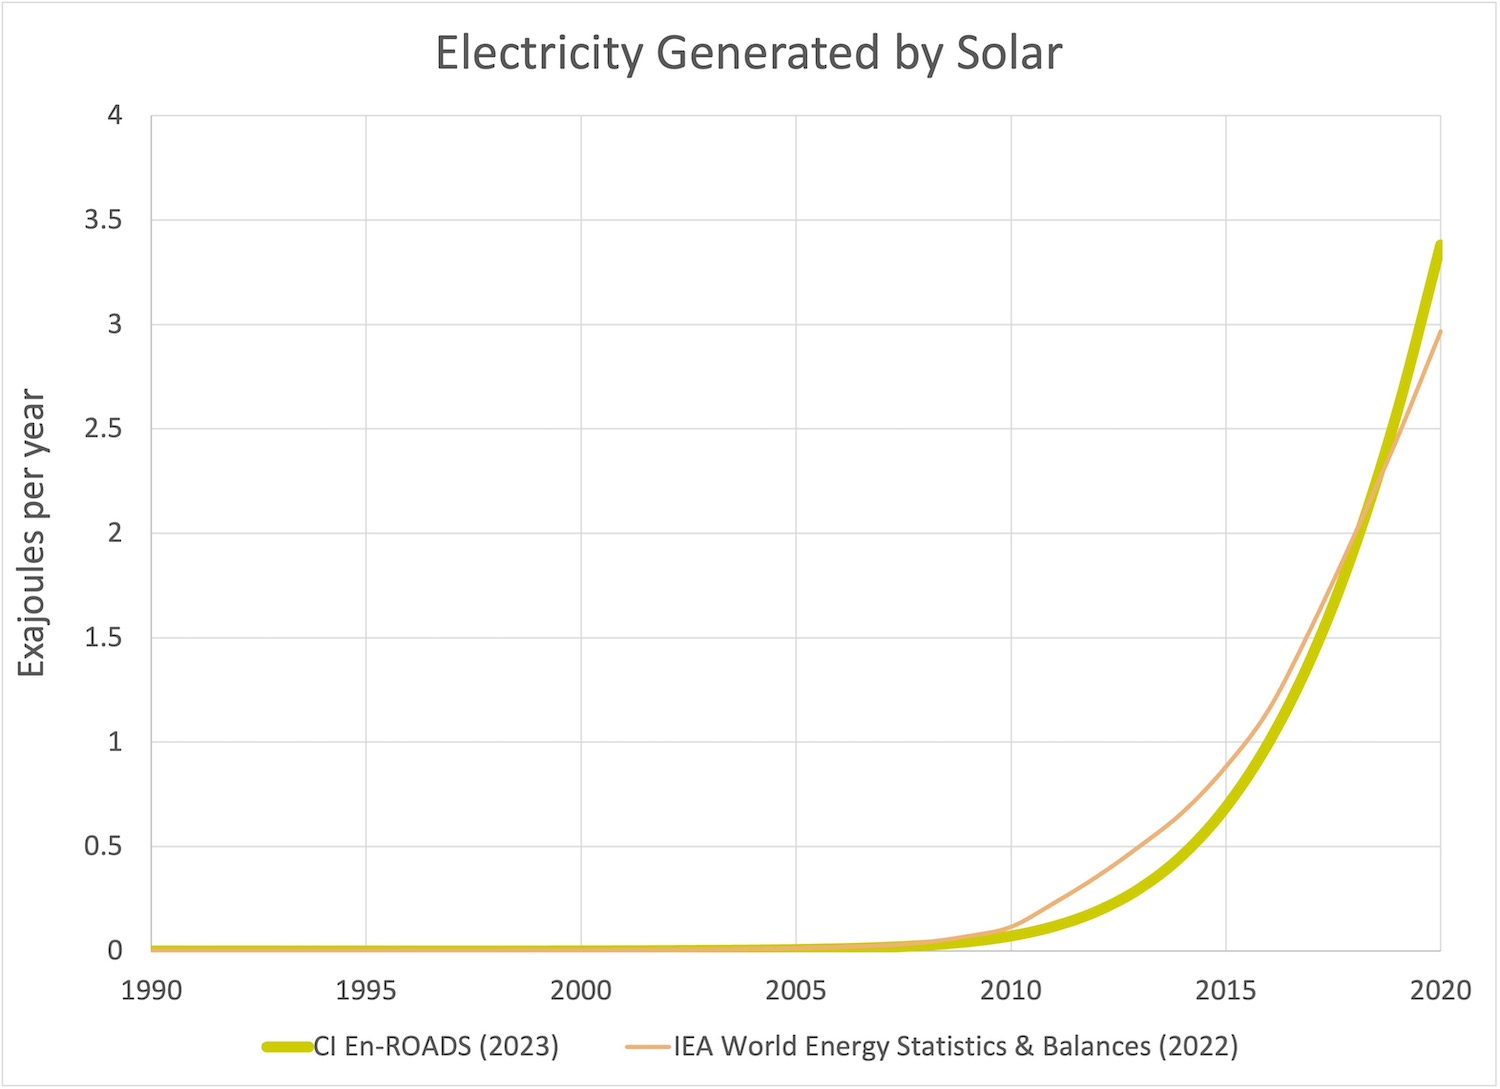
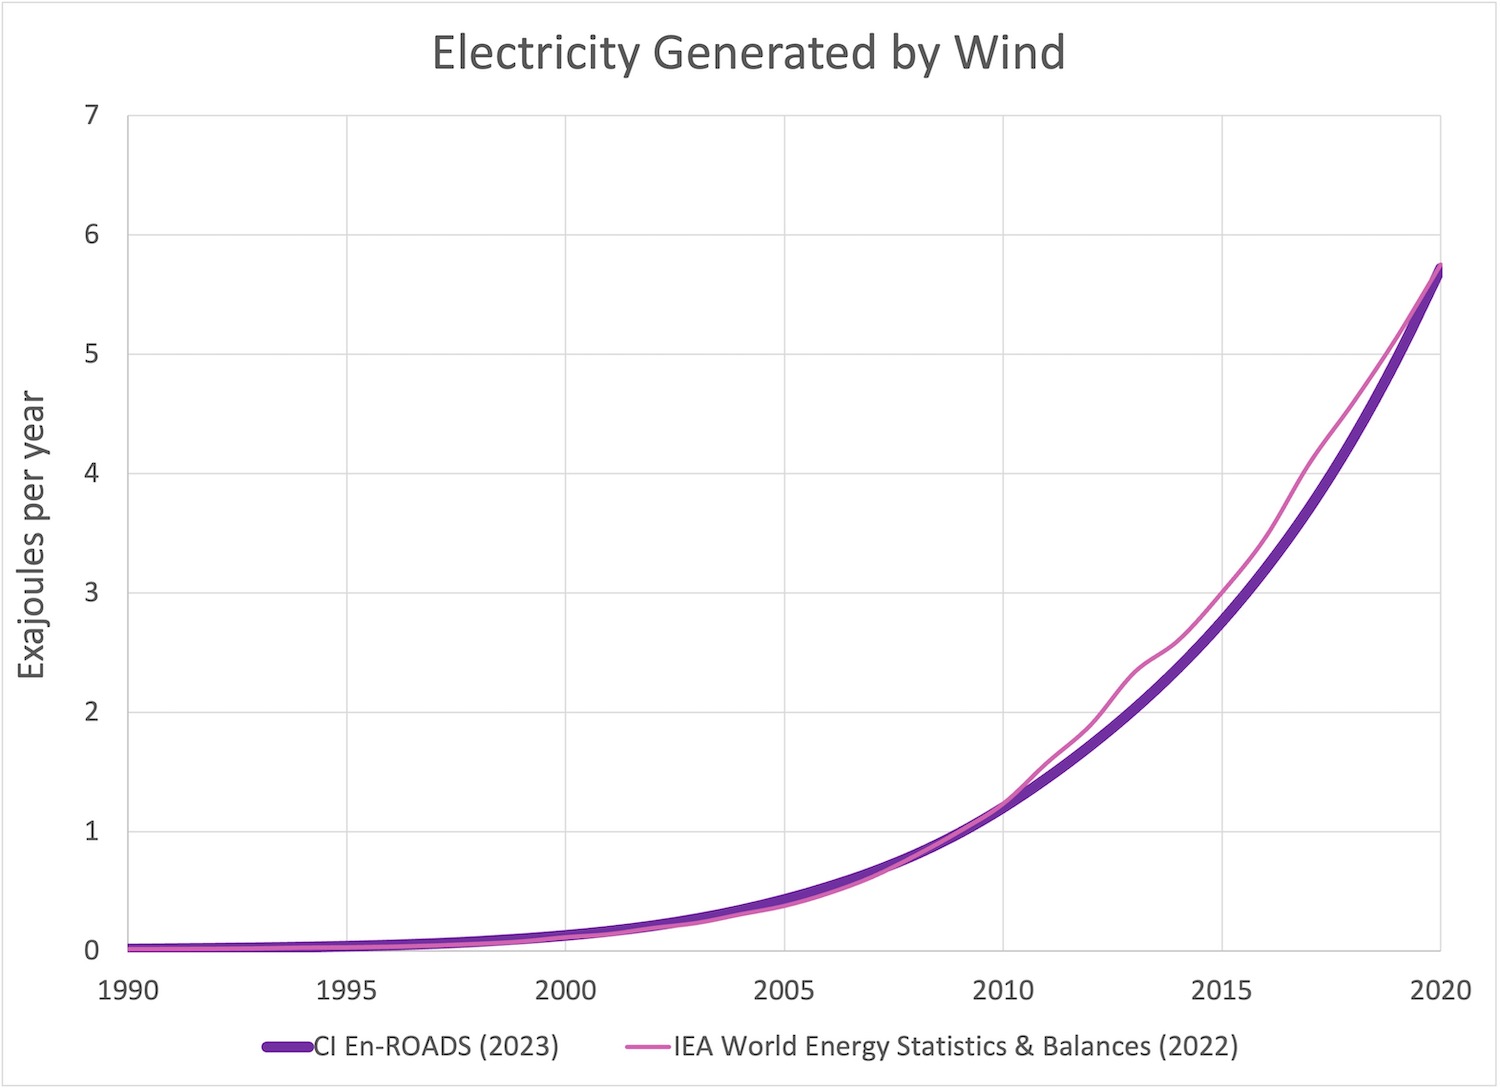
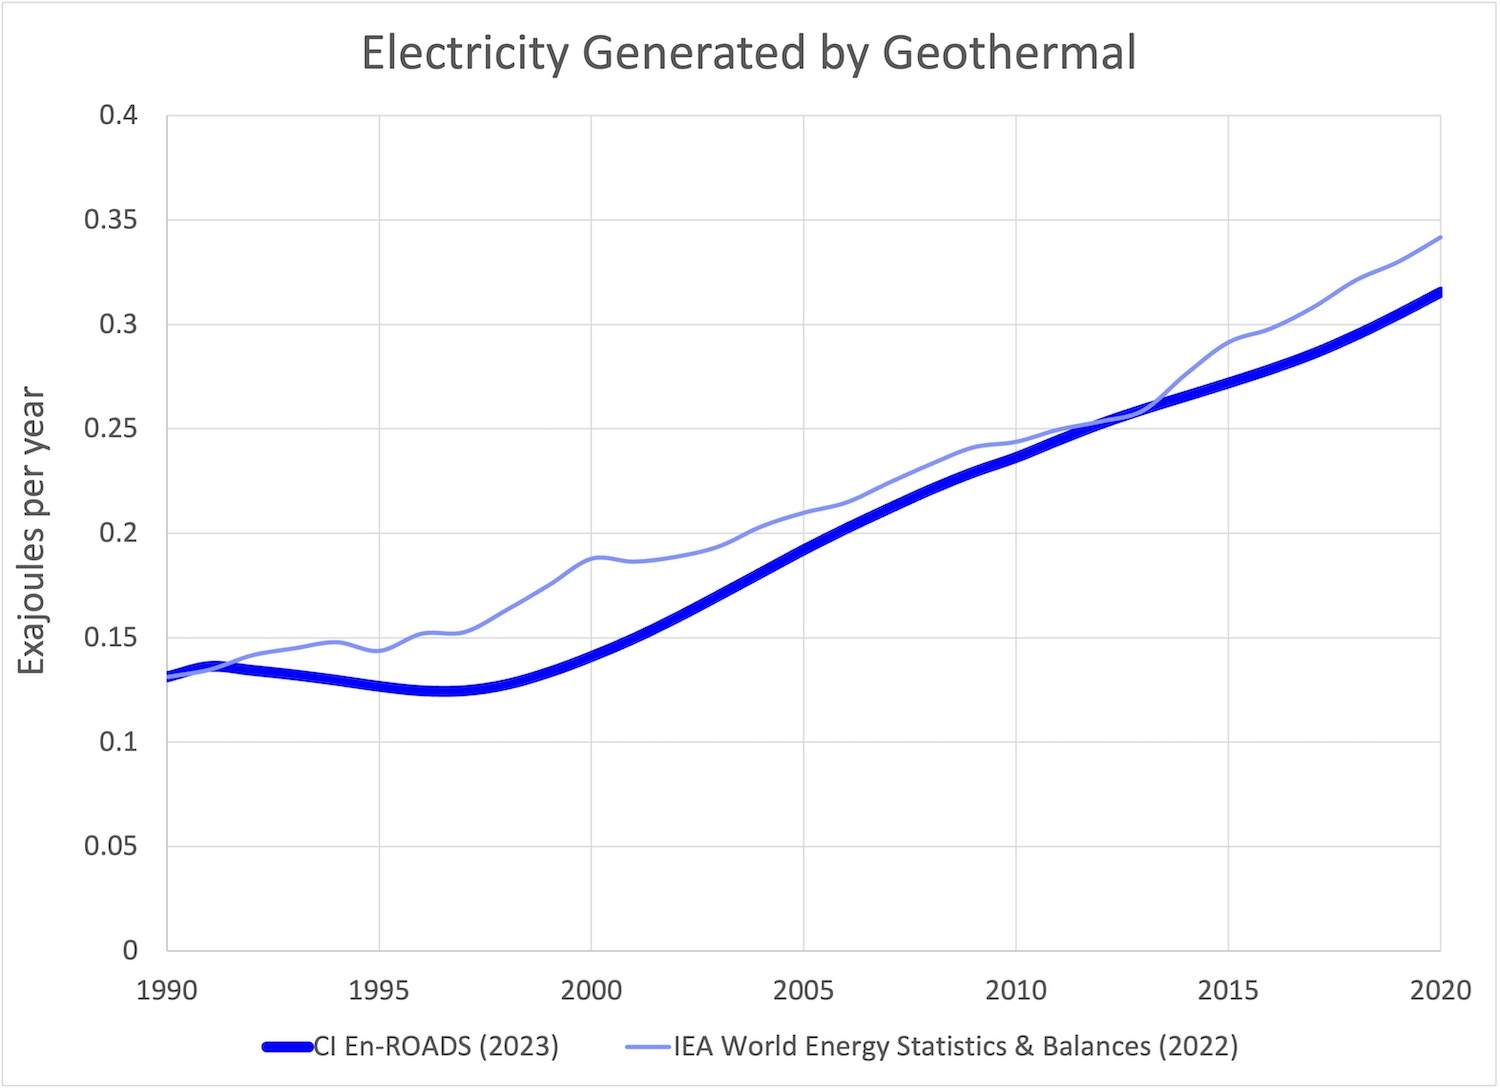
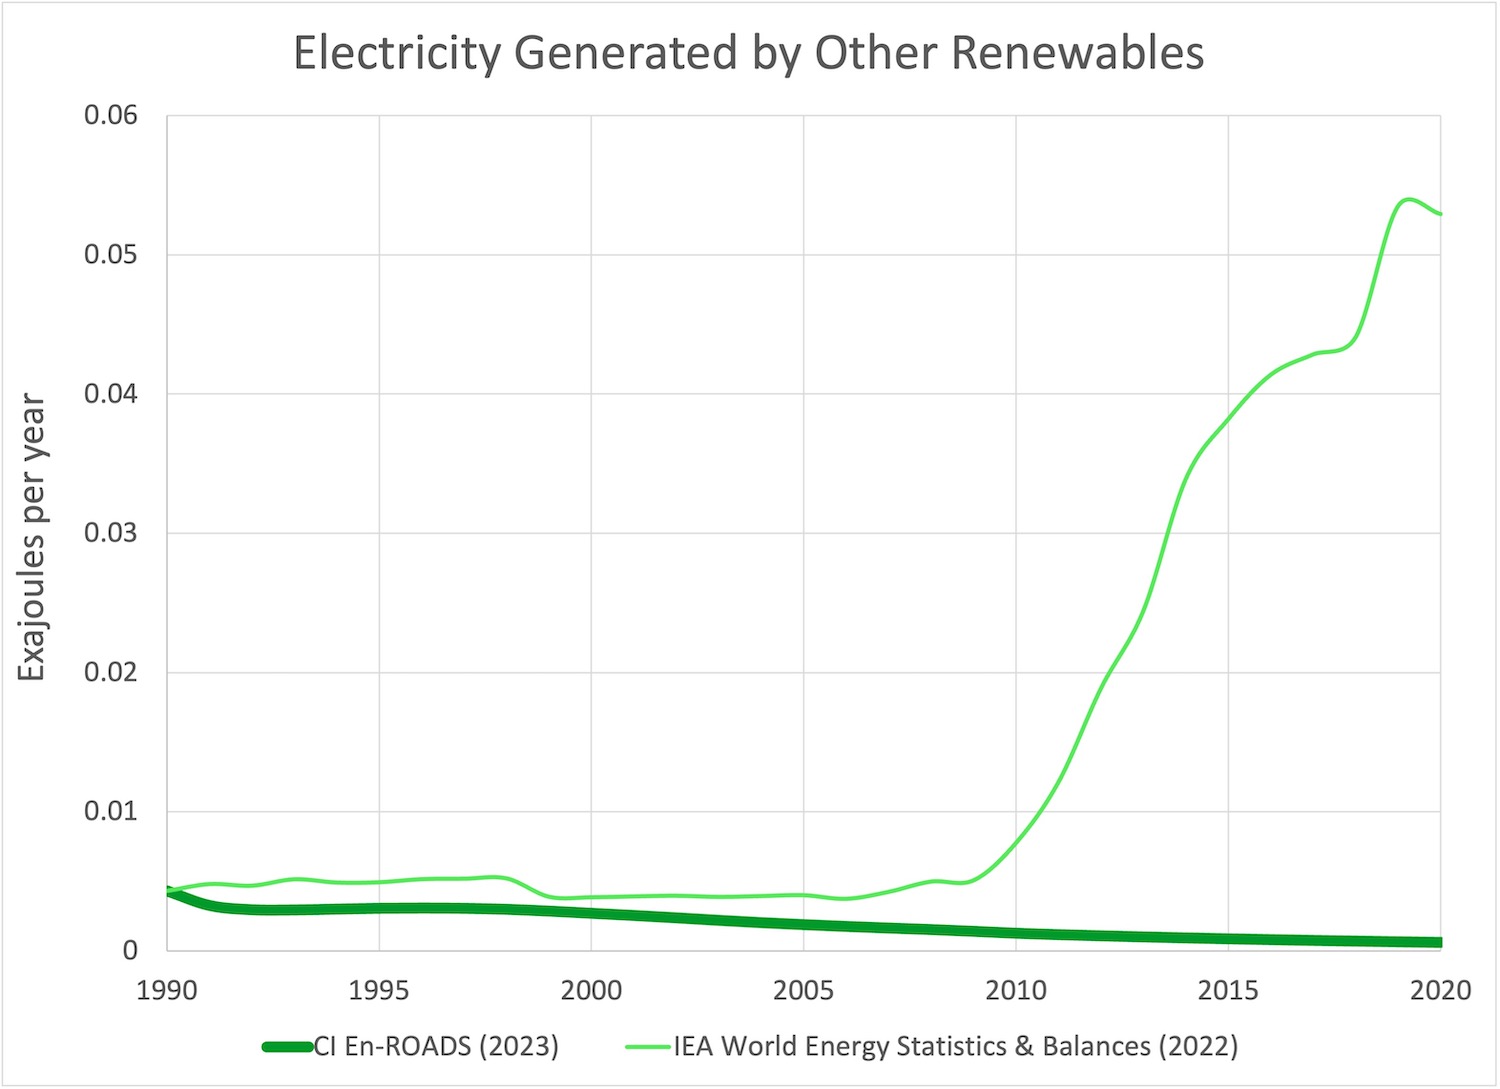
The electricity generated by energy sources in the En-ROADS Baseline Scenario compared to historical data.
Statistical fit🔗
Click here for descriptive statistics of En-ROADS fit to historical data.
Sources of historical data🔗
- IEA World Energy Statistics & Balances: IEA. (2022). World Energy Statistics & Balances.
Electricity Generated by Coal🔗
Electricity Generated by Oil🔗
Electricity Generated by Natural Gas🔗
Electricity Generated by Nuclear🔗
![]()
Electricity Generated by Bioenergy🔗
Electricity Generated by Hydro🔗
Electricity Generated by Solar🔗
Electricity Generated by Wind🔗
Electricity Generated by Geothermal🔗
Electricity Generated by Other Renewables🔗
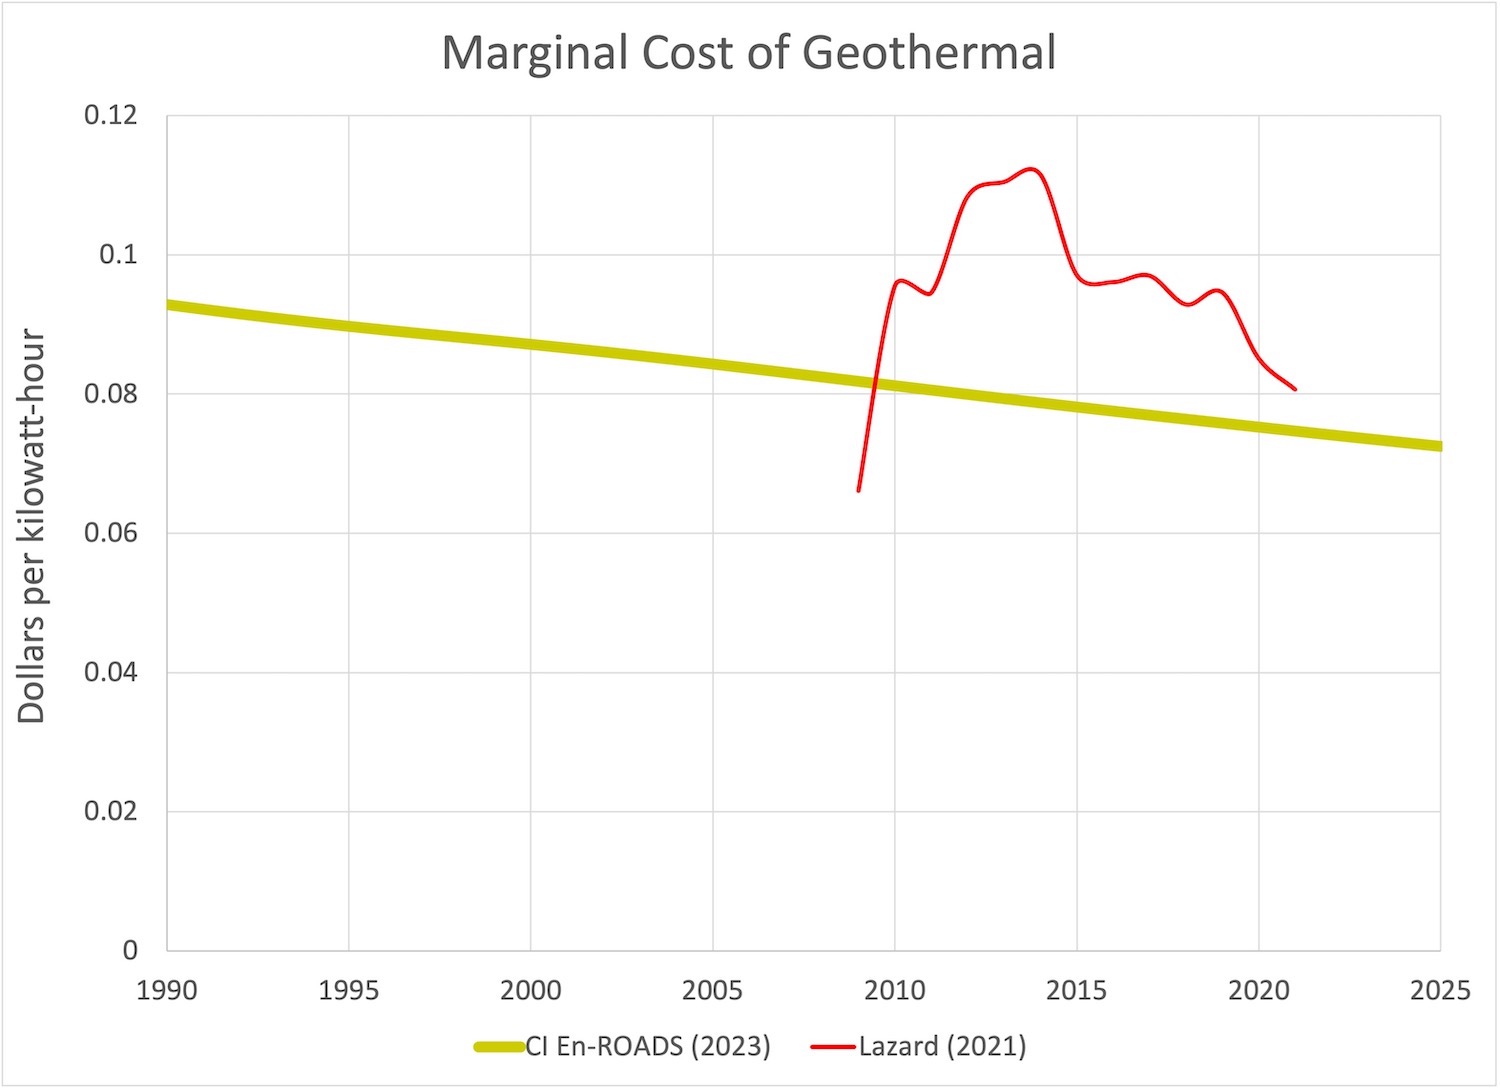
Marginal Cost of Wind, Solar, and Geothermal Electricity History🔗
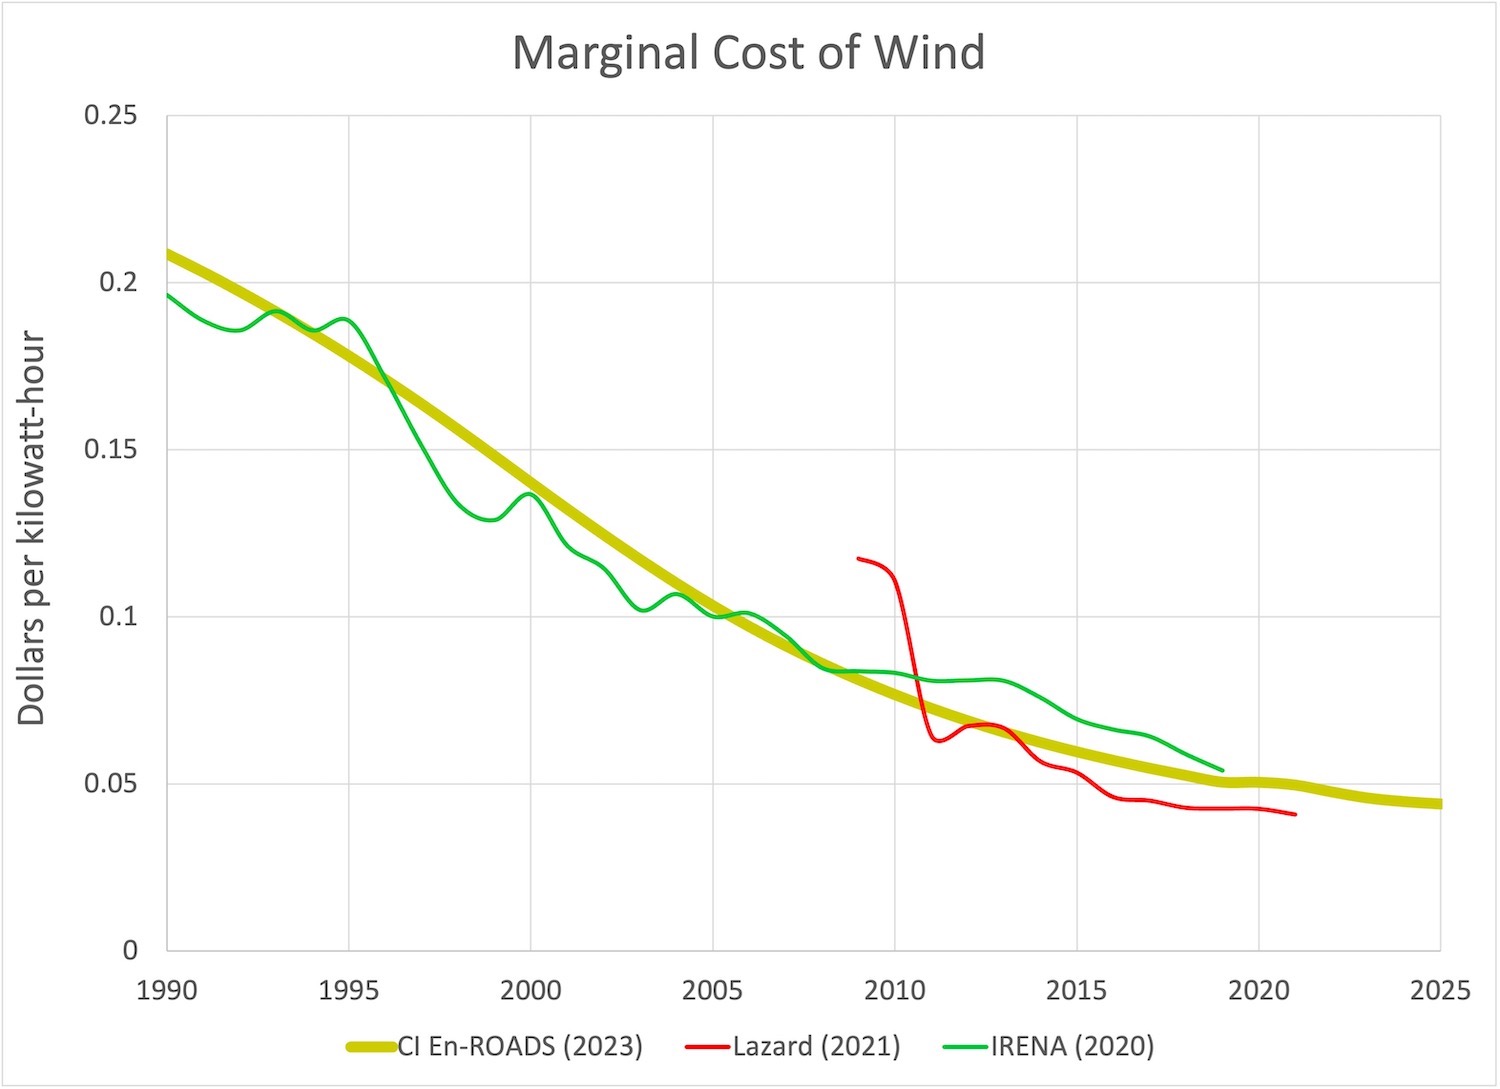
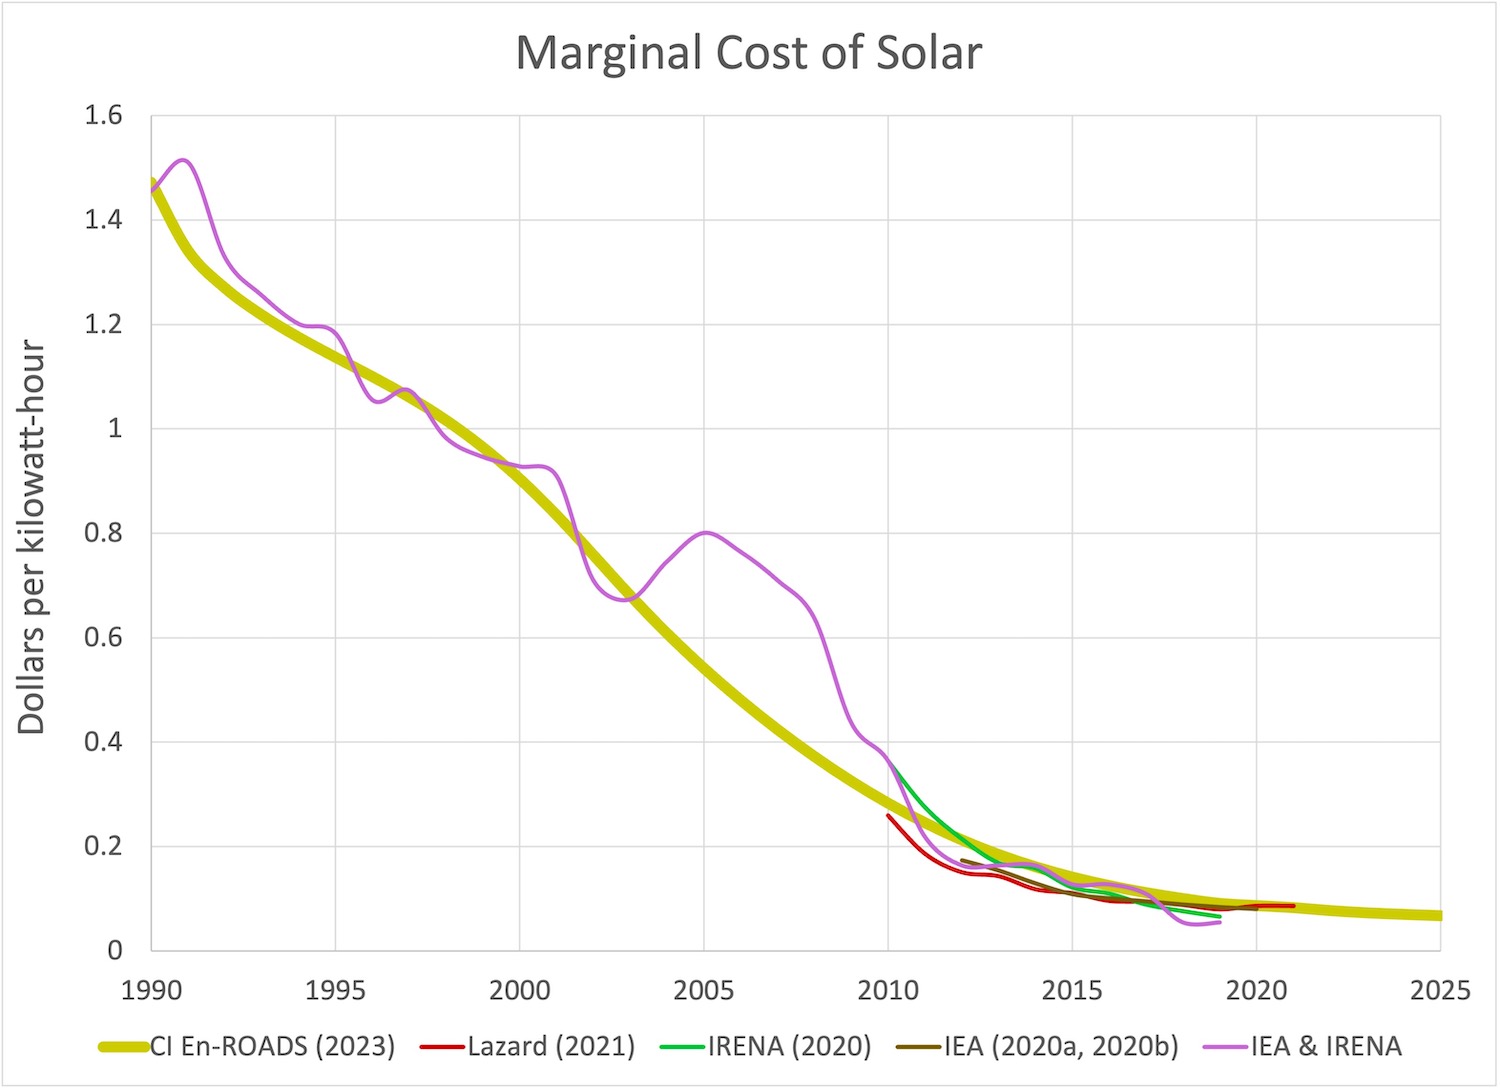
The marginal cost of electricity production from wind, solar, and geothermal energy in dollars ($US 2021) per kilowatt hour (kWh) in the En-ROADS Baseline compared to historical data. This is the marginal cost for energy producers to make electricity from a new solar, wind, or geothermal installation. The cost factors in how much it costs to build new energy generation facilities (the levelized capital costs) and how much it costs to operate and maintain new facilities (O&M).
For solar, the En-ROADS Baseline Scenario is shown relative to historical data from Lazard, IRENA, and IEA. The IEA & IRENA curve is calculated from IEA (2020) capital costs per GW from 1990-2019 relative to its 2010 value, and multiplied by IRENA's 2010 levelized cost of energy (LCOE) (2020).
For wind, the En-ROADS Baseline Scenario is shown relative to historical data from Lazard and IRENA. For geothermal, the En-ROADS Baseline Scenario is shown relative to historical data from Lazard.
Statistical fit🔗
Click here for descriptive statistics of En-ROADS fit to historical data.
Sources of historical data🔗
- IEA. (2020a). Evolution of solar PV module cost by data source, 1970-2020.
- IEA. (2020b). Global average LCOEs and auction results for utility-scale PV by commissioning date.
- IRENA. (2020). Renewable Power Generation Costs in 2019.
- Lazard. (2021). Lazard's Levelized Cost of Energy Analysis - Version 15.0.
Marginal Cost of Wind🔗
Marginal Cost of Solar🔗
Marginal Cost of Geothermal🔗
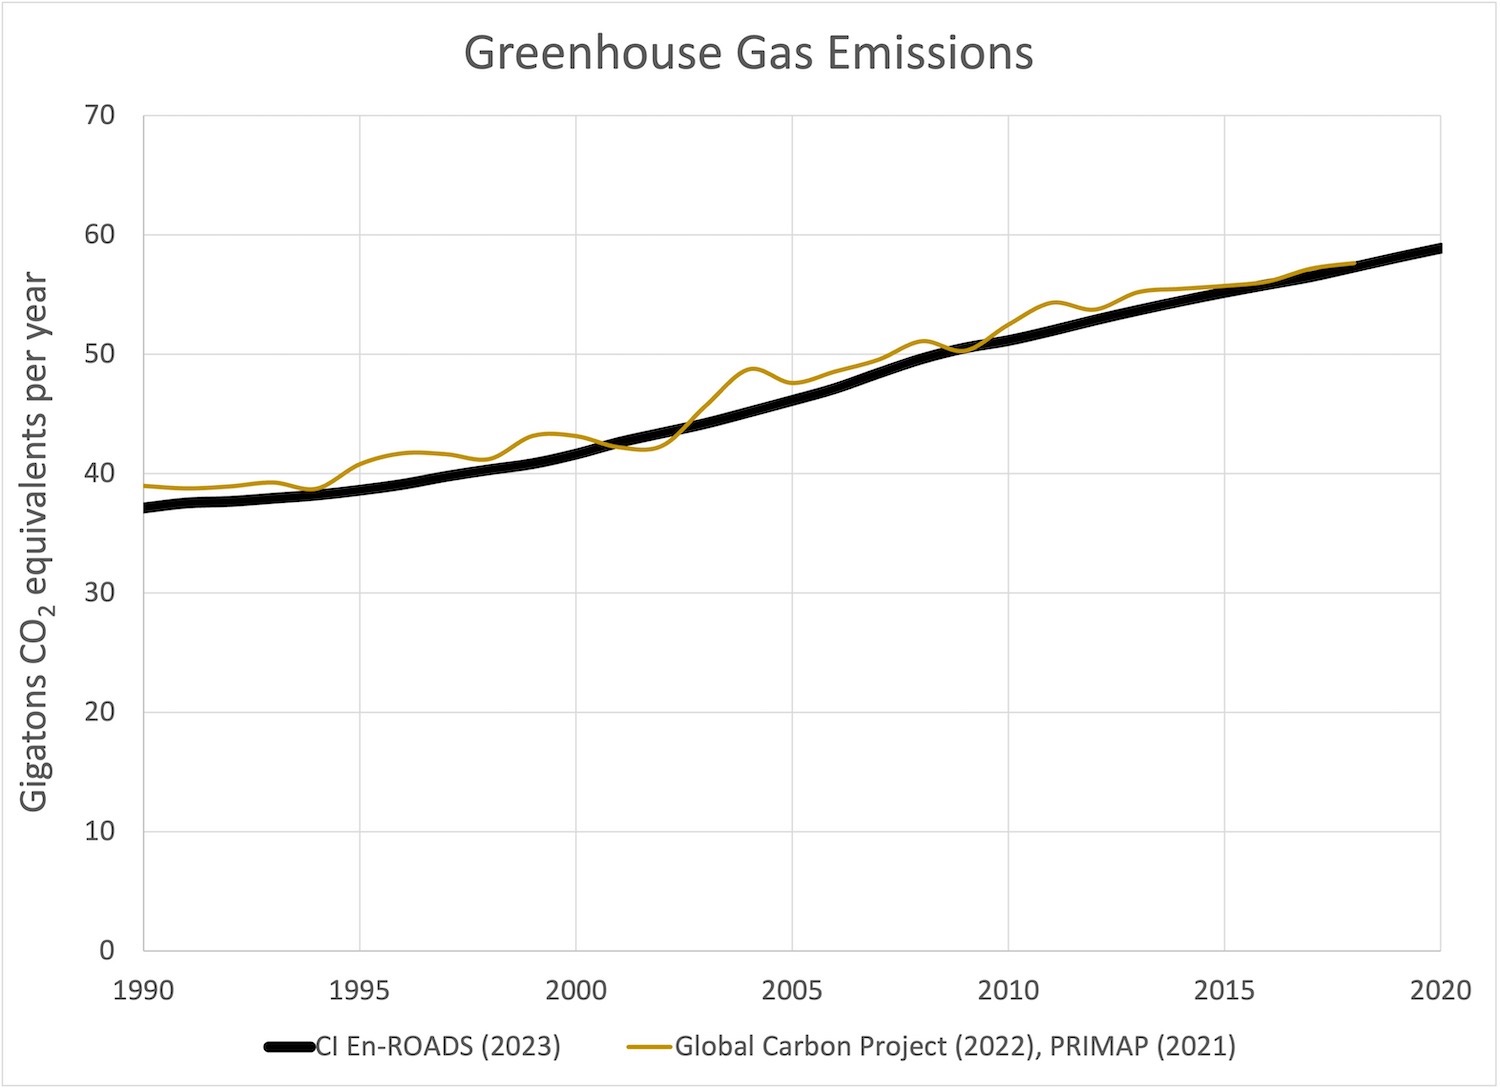
Emissions History🔗
- Greenhouse Gas Net Emissions
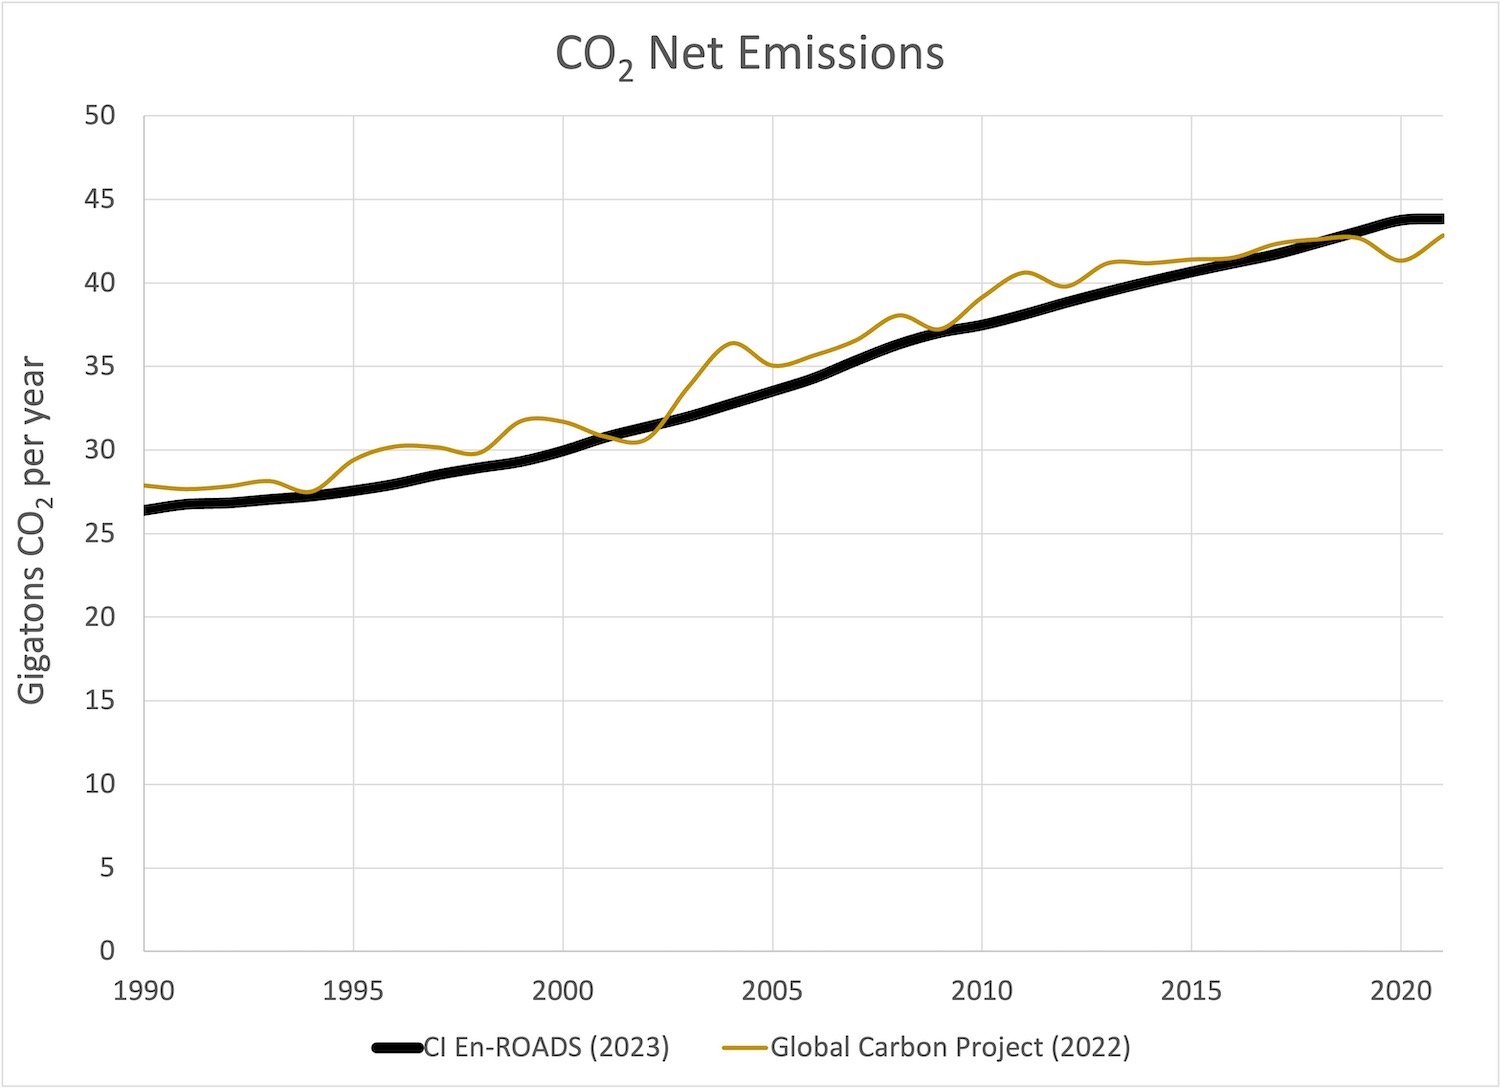
- CO2 Net Emissions
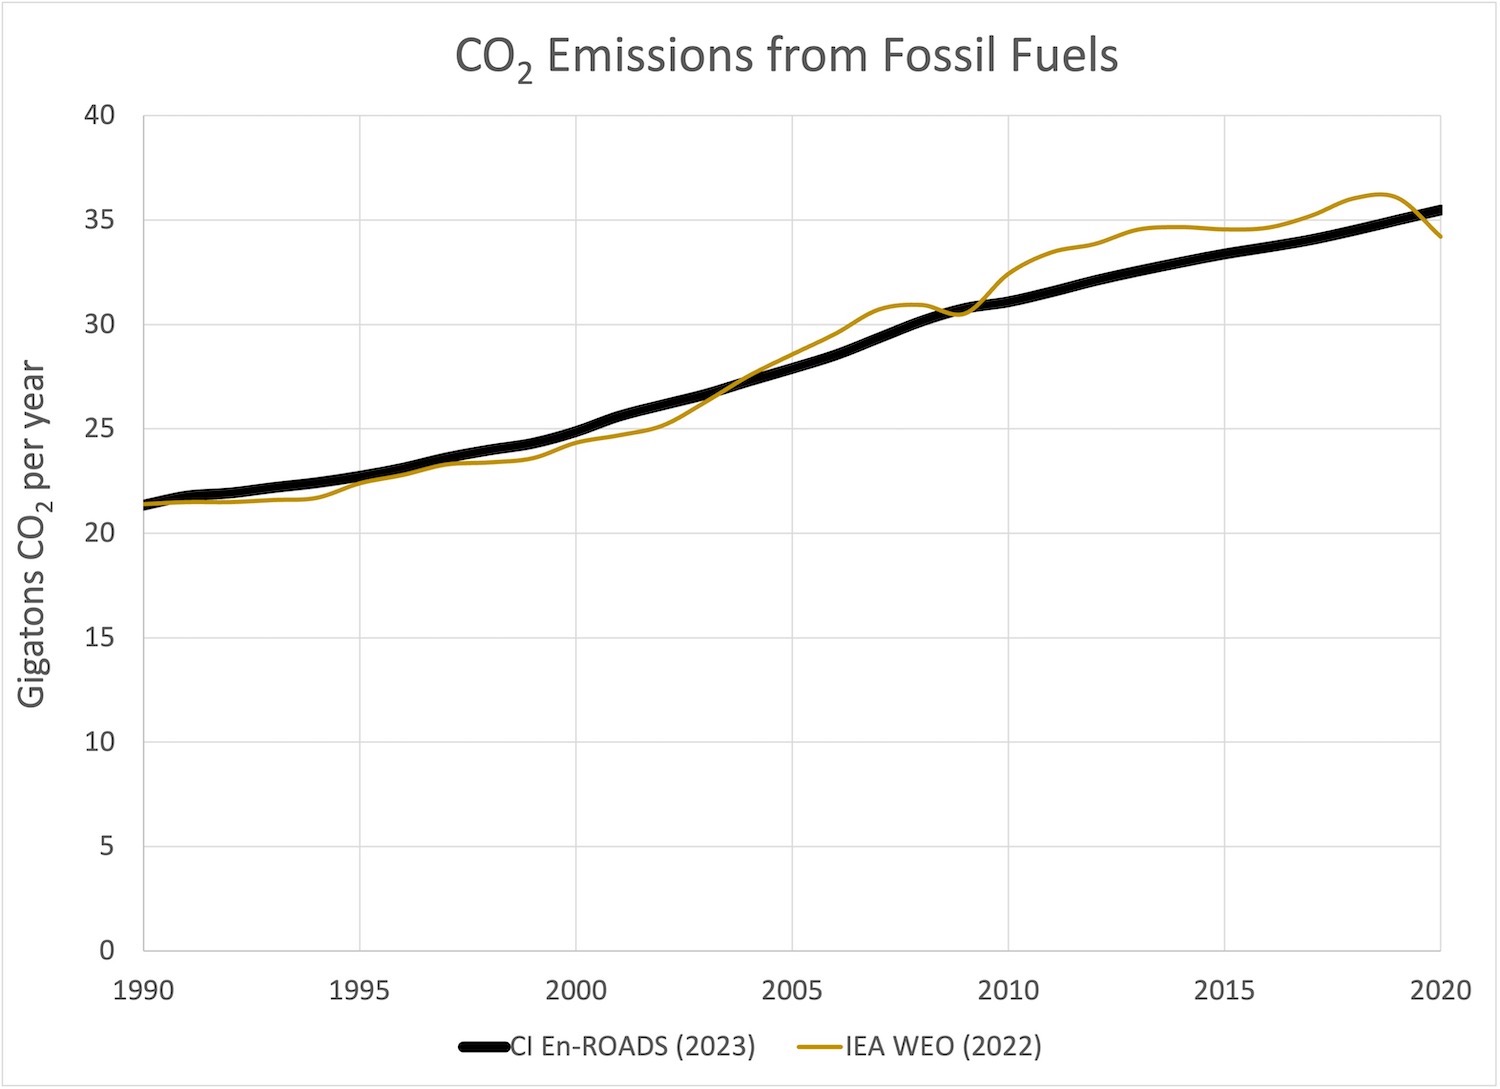
- CO2 Emissions from Fossil Fuels
- CH4 Emissions
- N2O Emissions
- F-Gas Emissions
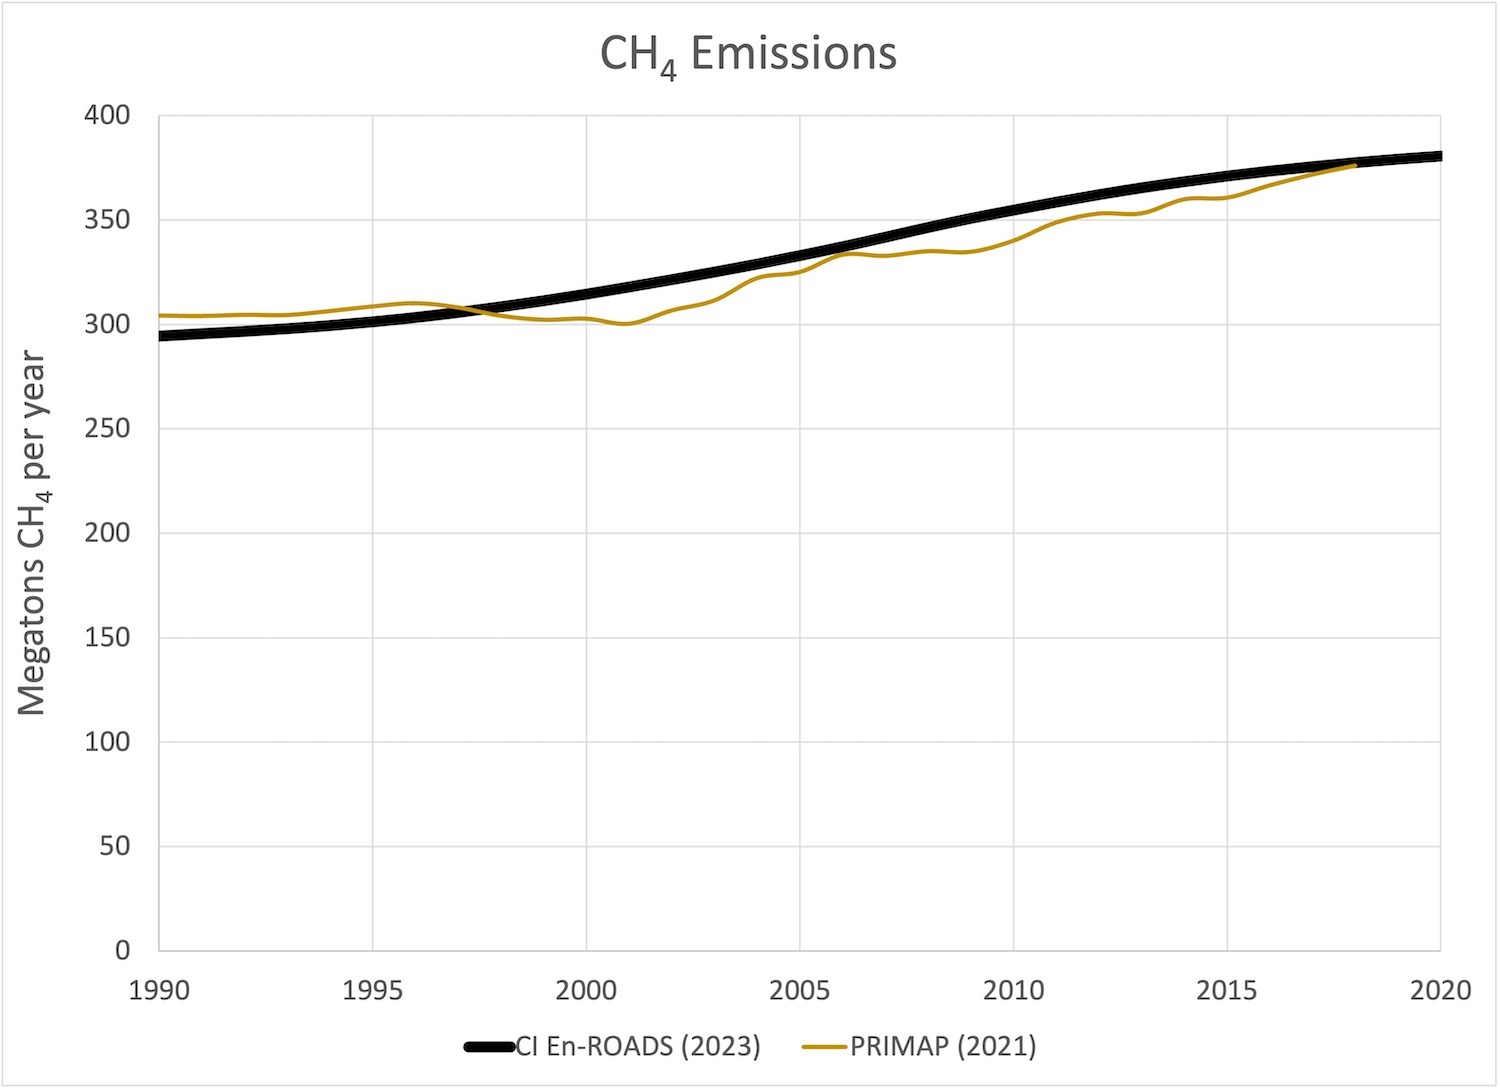
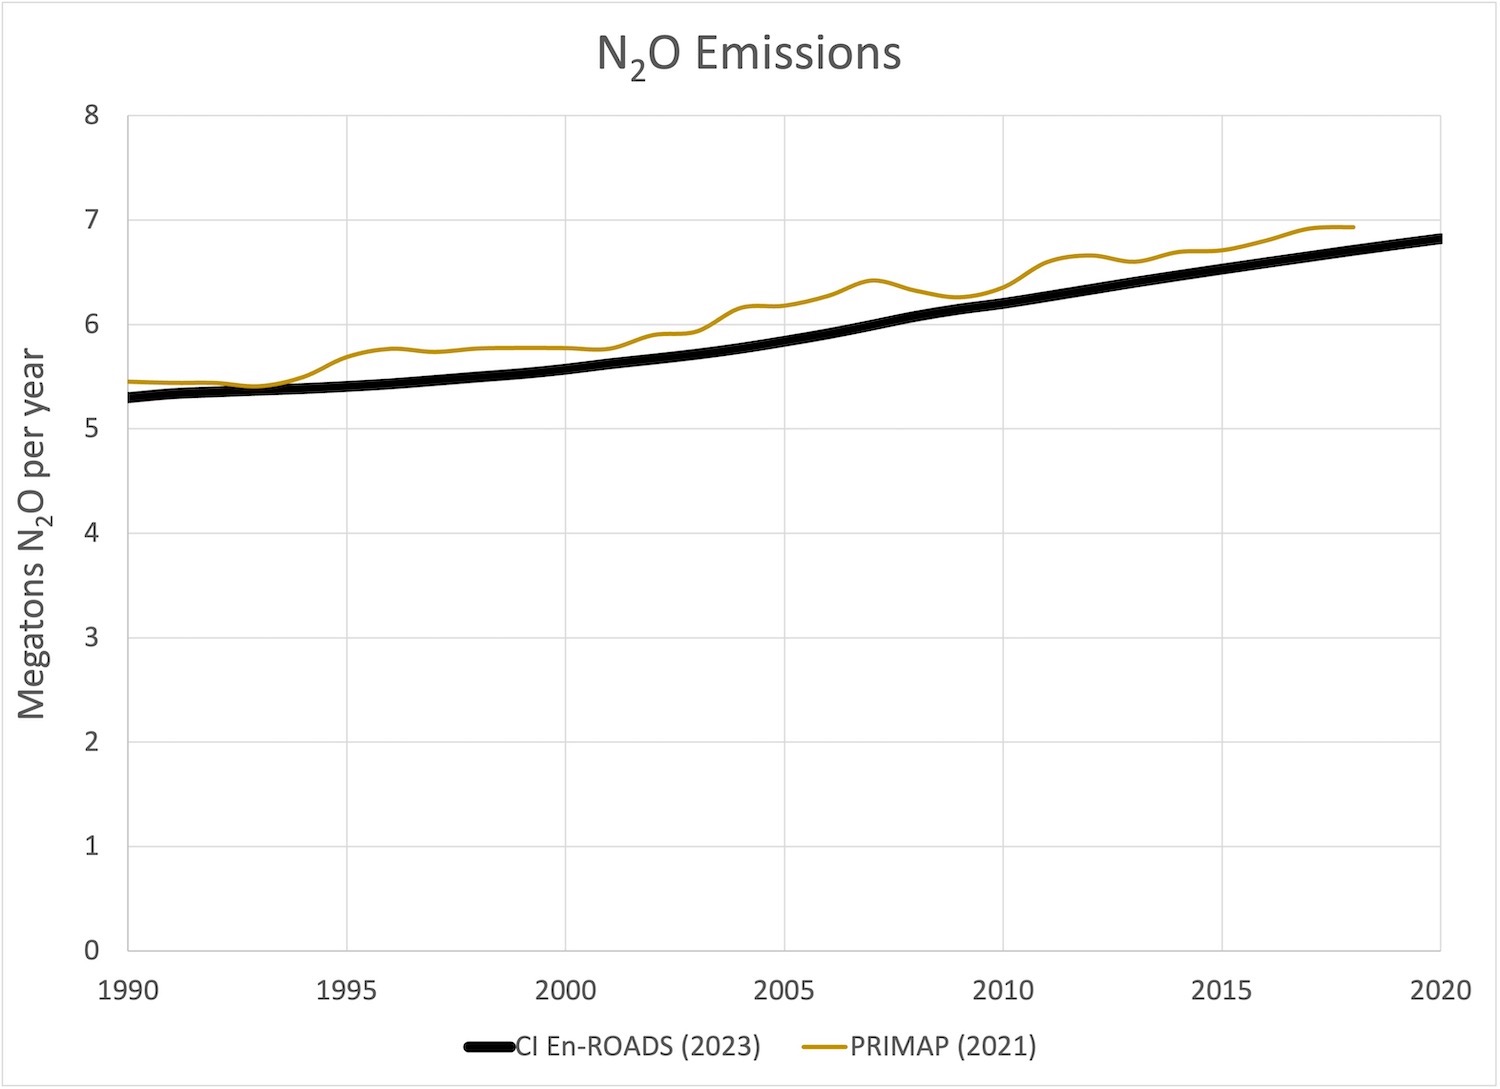
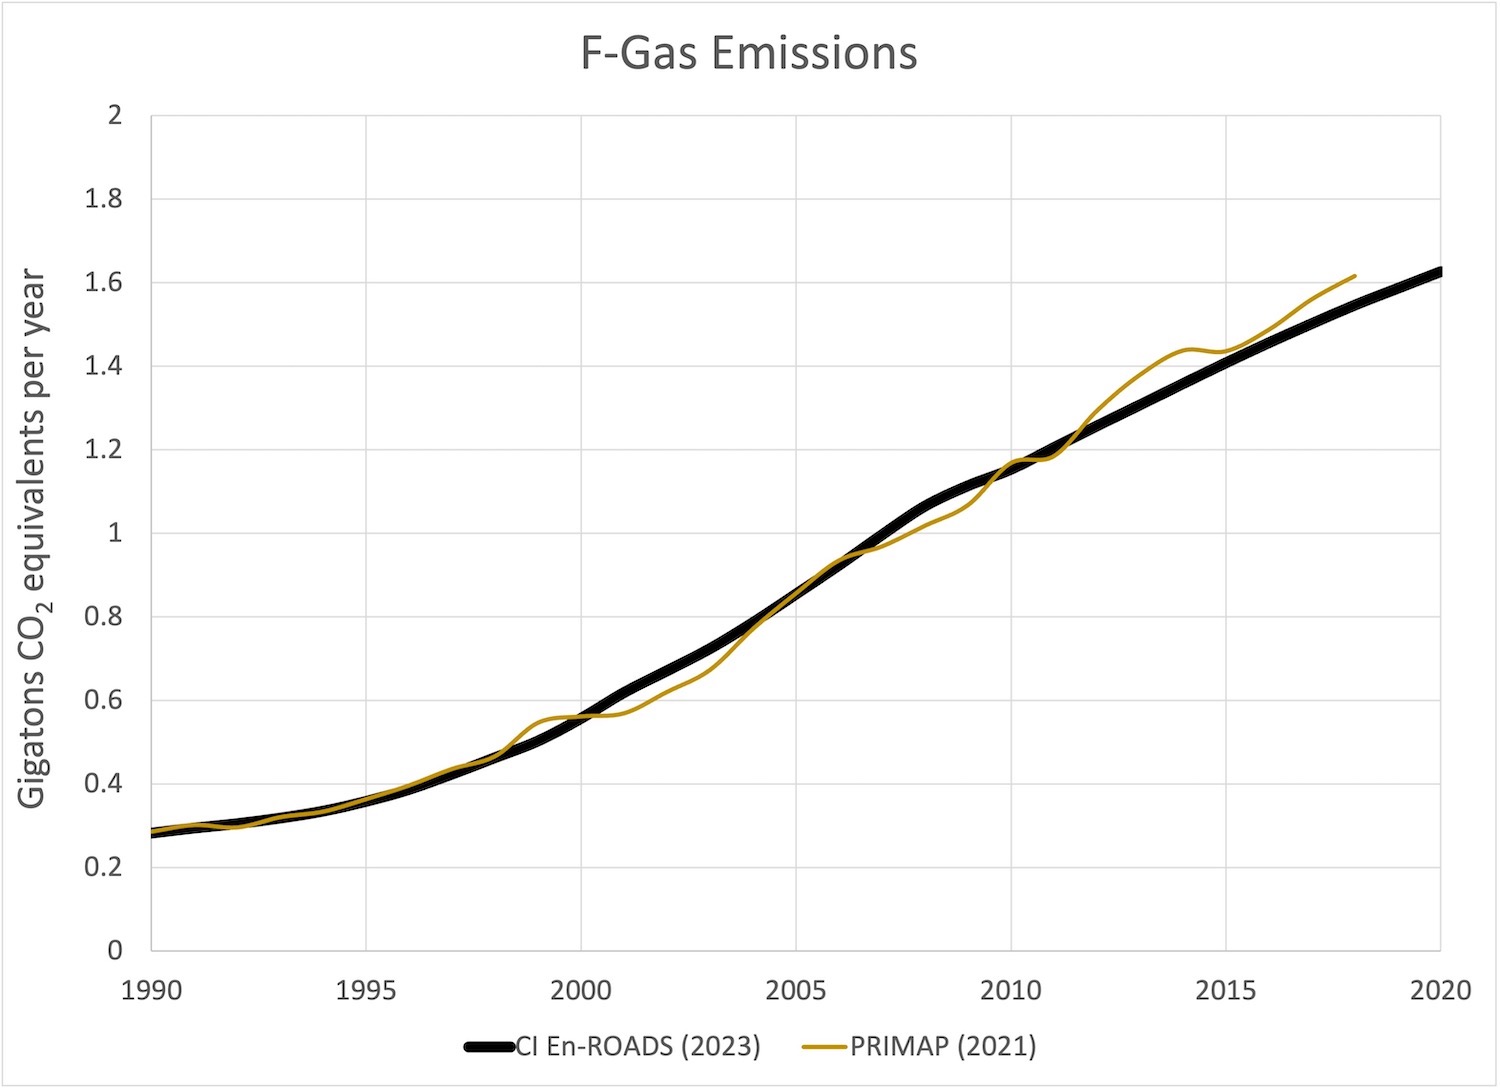
Global greenhouse gas emissions (GHGs) in the En-ROADS Baseline Scenario and historical data, in gigatons of CO2 or CO2 equivalents per year. CO2 equivalents are used to standardize the effect of all greenhouse gases in terms of CO2.
The Greenhouse Gas Net Emissions graph measures the total gross greenhouse gas emissions minus the total net anthropogenic carbon dioxide removal (CDR). Contributions to gross GHGs are from carbon dioxide (CO2), nitrous oxide (N2O), methane (CH4), and the F-gases (HFCs, PFCs, and SF6).
Statistical fit🔗
Click here for descriptive statistics of En-ROADS fit to historical data.
Sources of historical data🔗
- Global Carbon Project: Friedlingstein, P., et al. (2022). Global carbon budget 2022. Earth System Science Data, 14, 4811–4900. [CO2 energy emissions only]
- IEA WEO: IEA. (2022). World Energy Outlook 2022.
- PRIMAP: Gütschow, J., Günther, A., & Pflüger, M. (2021). The PRIMAP-hist national historical emissions time series (1850-2018). v2.3.1. [Non-CO2 greenhouse gas emissions only]
Greenhouse Gas Net Emissions🔗
CO2 Net Emissions🔗
CO2 Emissions from Fossil Fuels🔗
CH4 Emissions🔗
N2O Emissions🔗
F-Gas Emissions🔗
Atmospheric Concentrations History🔗
- CO2 Concentration in the Atmosphere
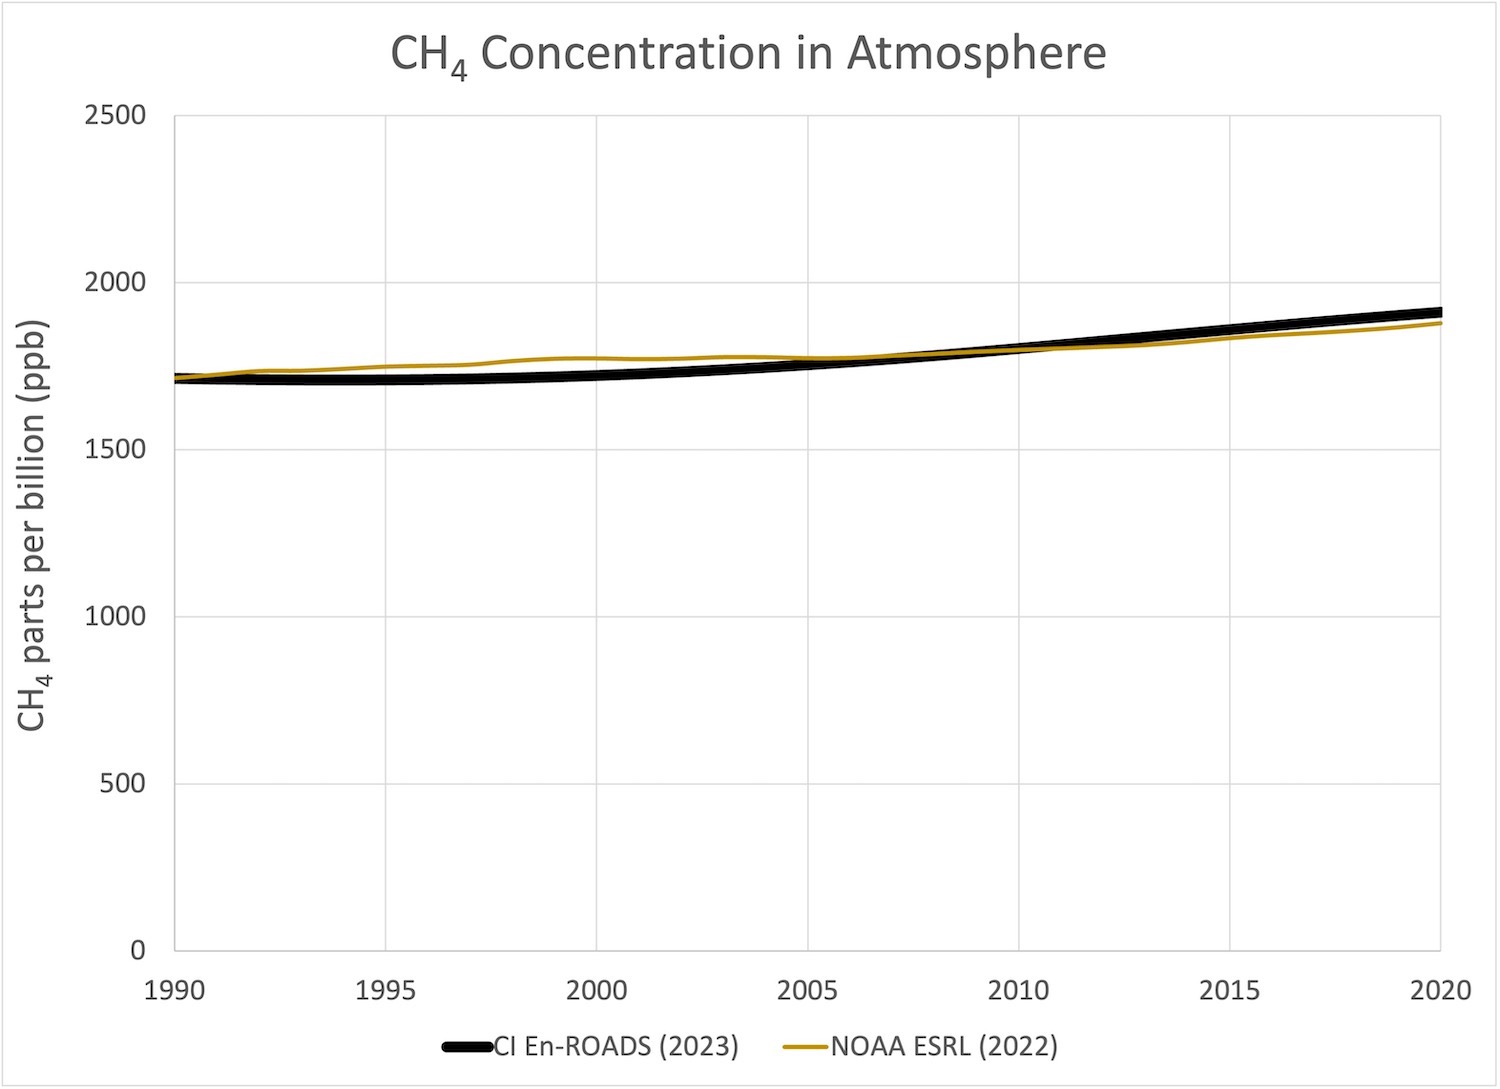
- CH4 Concentration in the Atmosphere
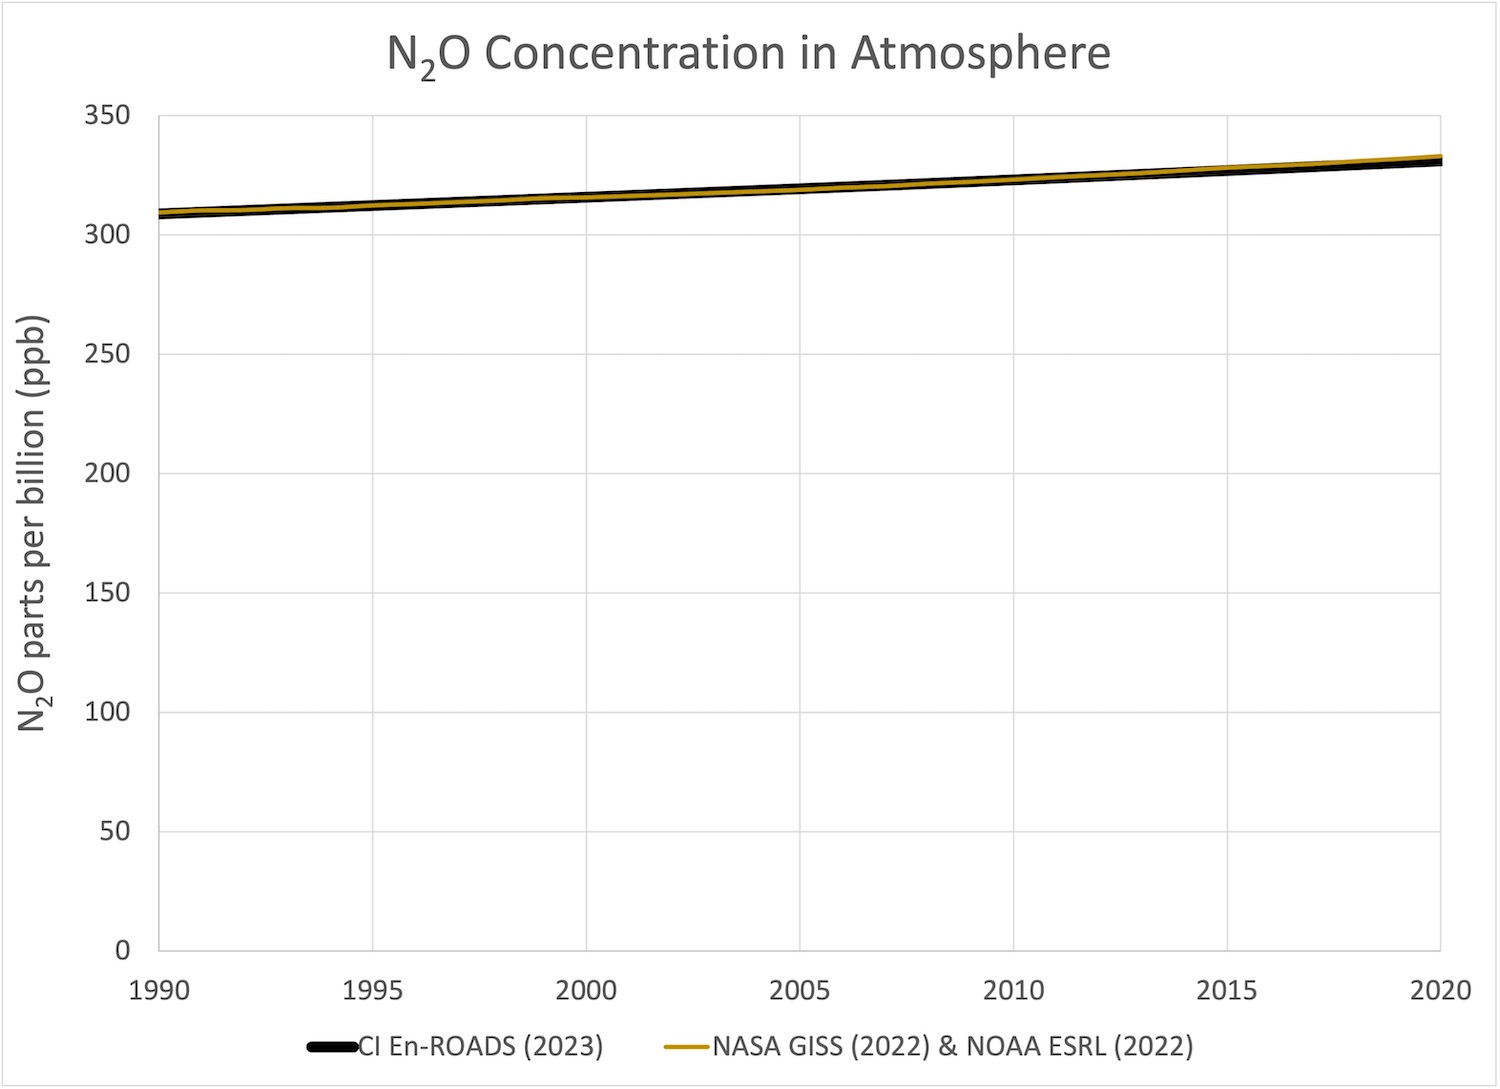
- N2O Concentration in the Atmosphere
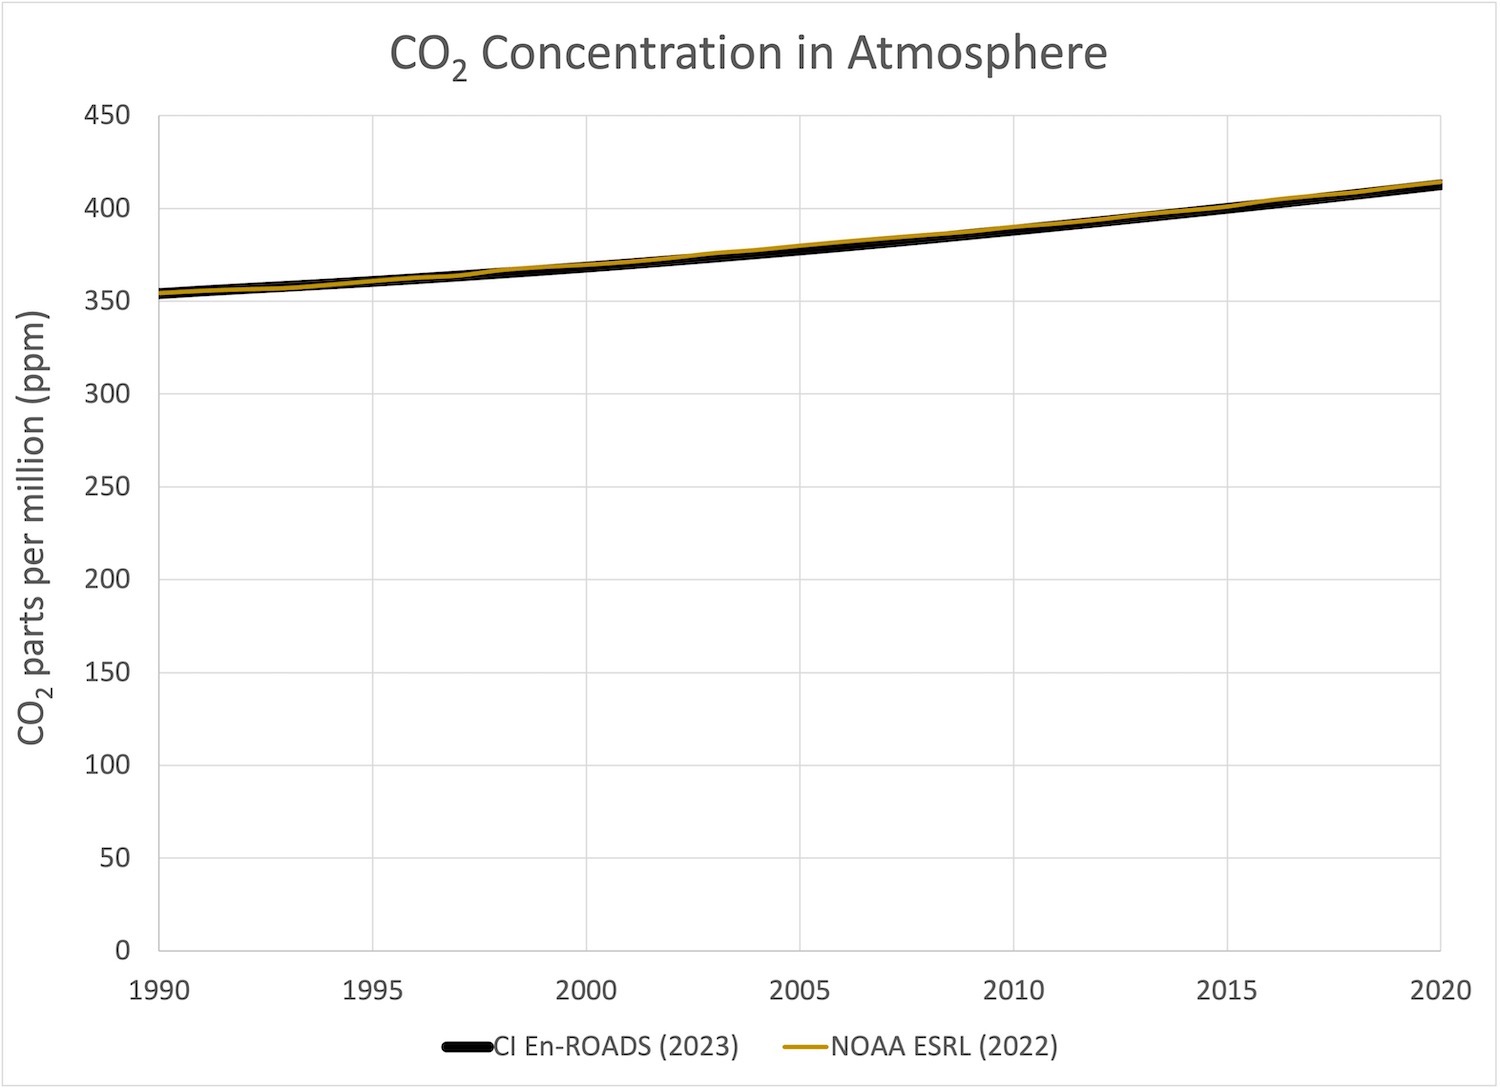
The total concentration of CO2, CH4, and N2O in parts per million (ppm) of CO2 equivalents in the atmosphere in the En-ROADS Baseline Scenario compared to historical data.
Carbon dioxide equivalents (CO2e) are calculated from the 100-year global warming potential of each gas (IPCC AR5) for reporting purposes. Note the radiative forcing of each gas is modeled explicitly as a function of its atmospheric cycle and radiative efficiency.
Statistical fit🔗
Click here for descriptive statistics of En-ROADS fit to historical data.
Sources of historical data🔗
- NASA GISS. (2022). GISS Surface Temperature Analysis (GISTEMP), version 4. NASA Goddard Institute for Space Studies.
- NOAA ESRL: NOAA. (2022). Trends in Atmospheric Carbon Dioxide.
CO2 Concentration in the Atmosphere🔗
CH4 Concentration in the Atmosphere🔗
N2O Concentration in the Atmosphere🔗
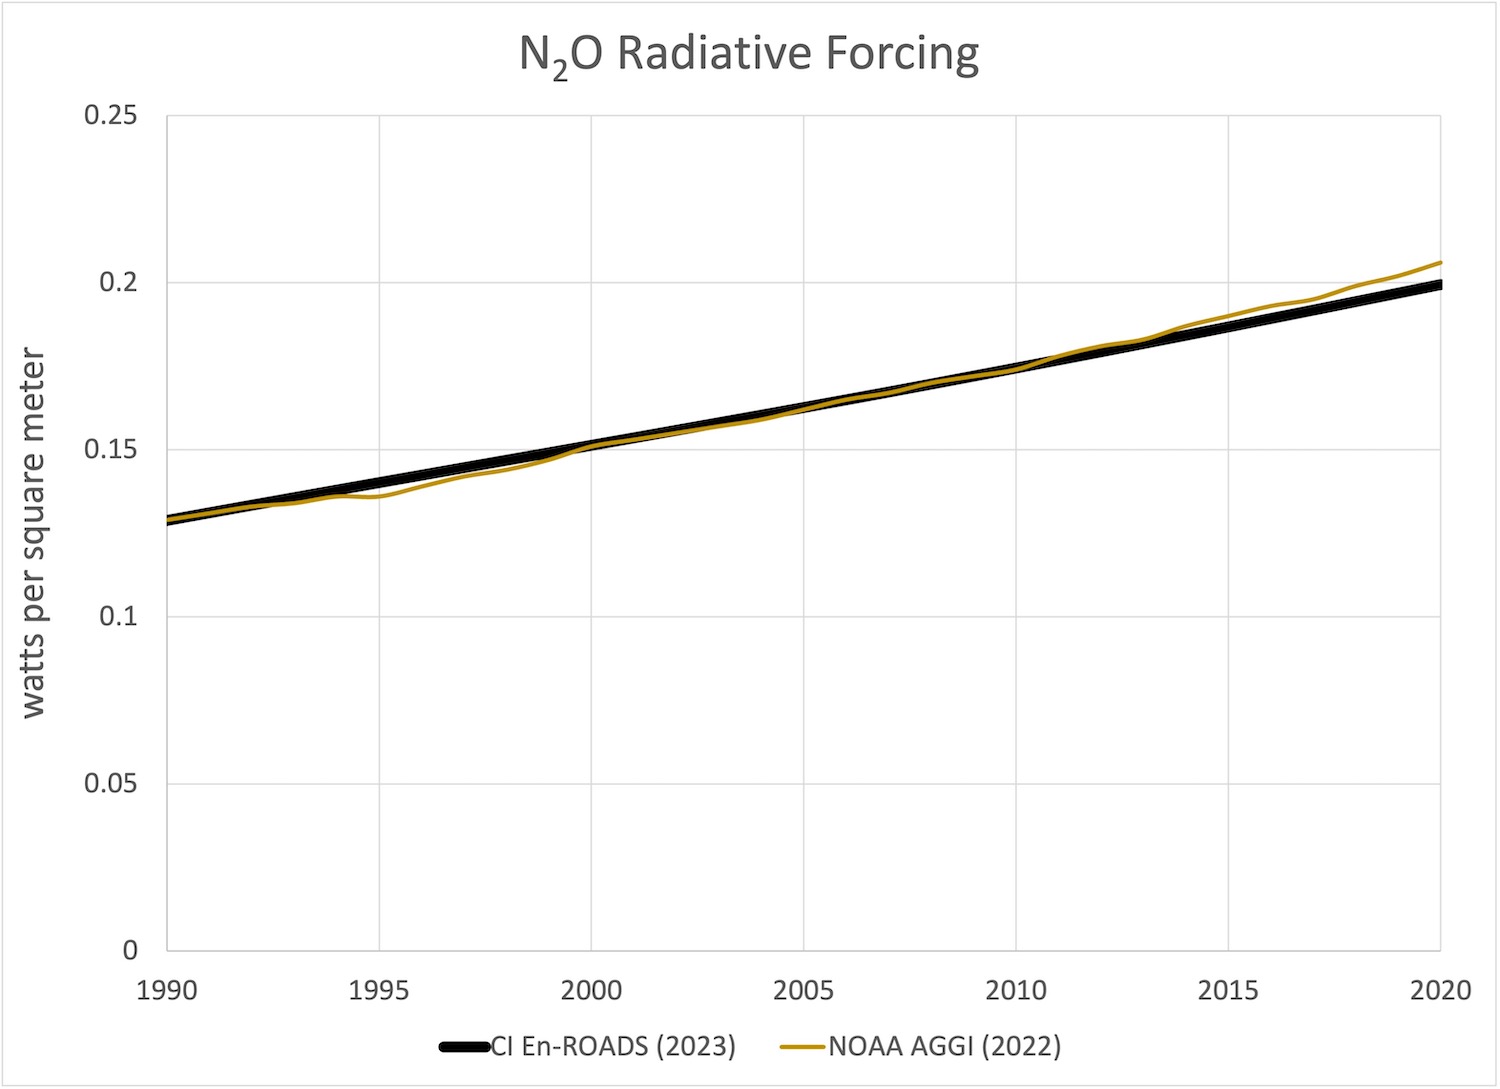
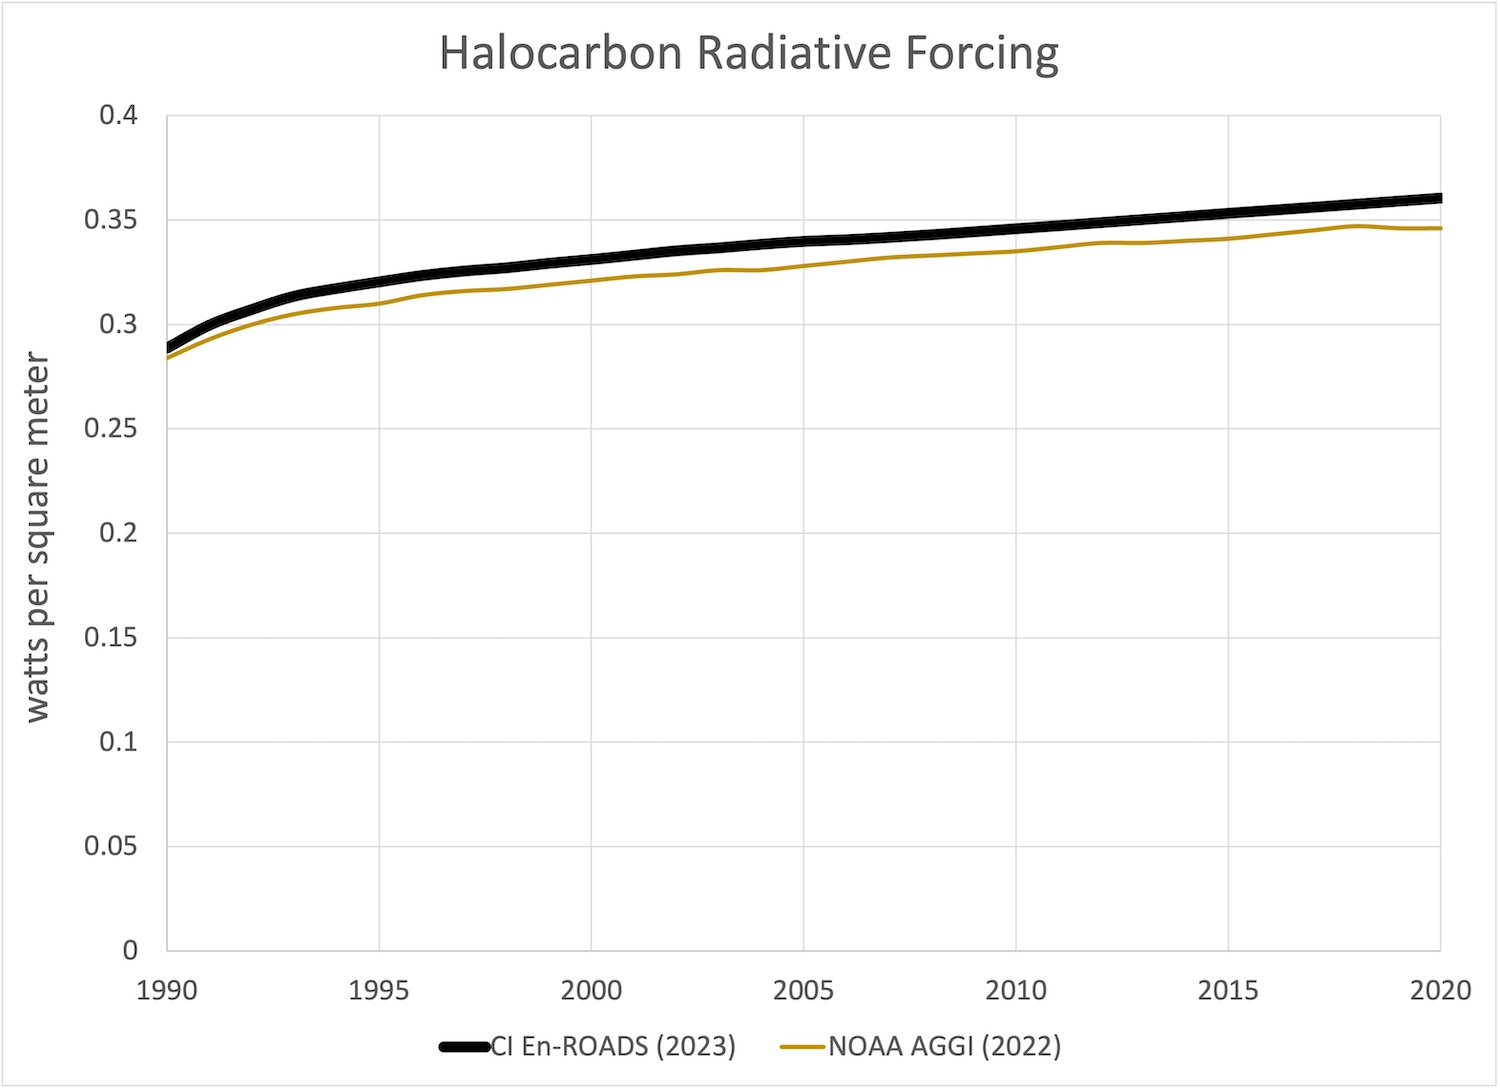
Radiative Forcing History🔗
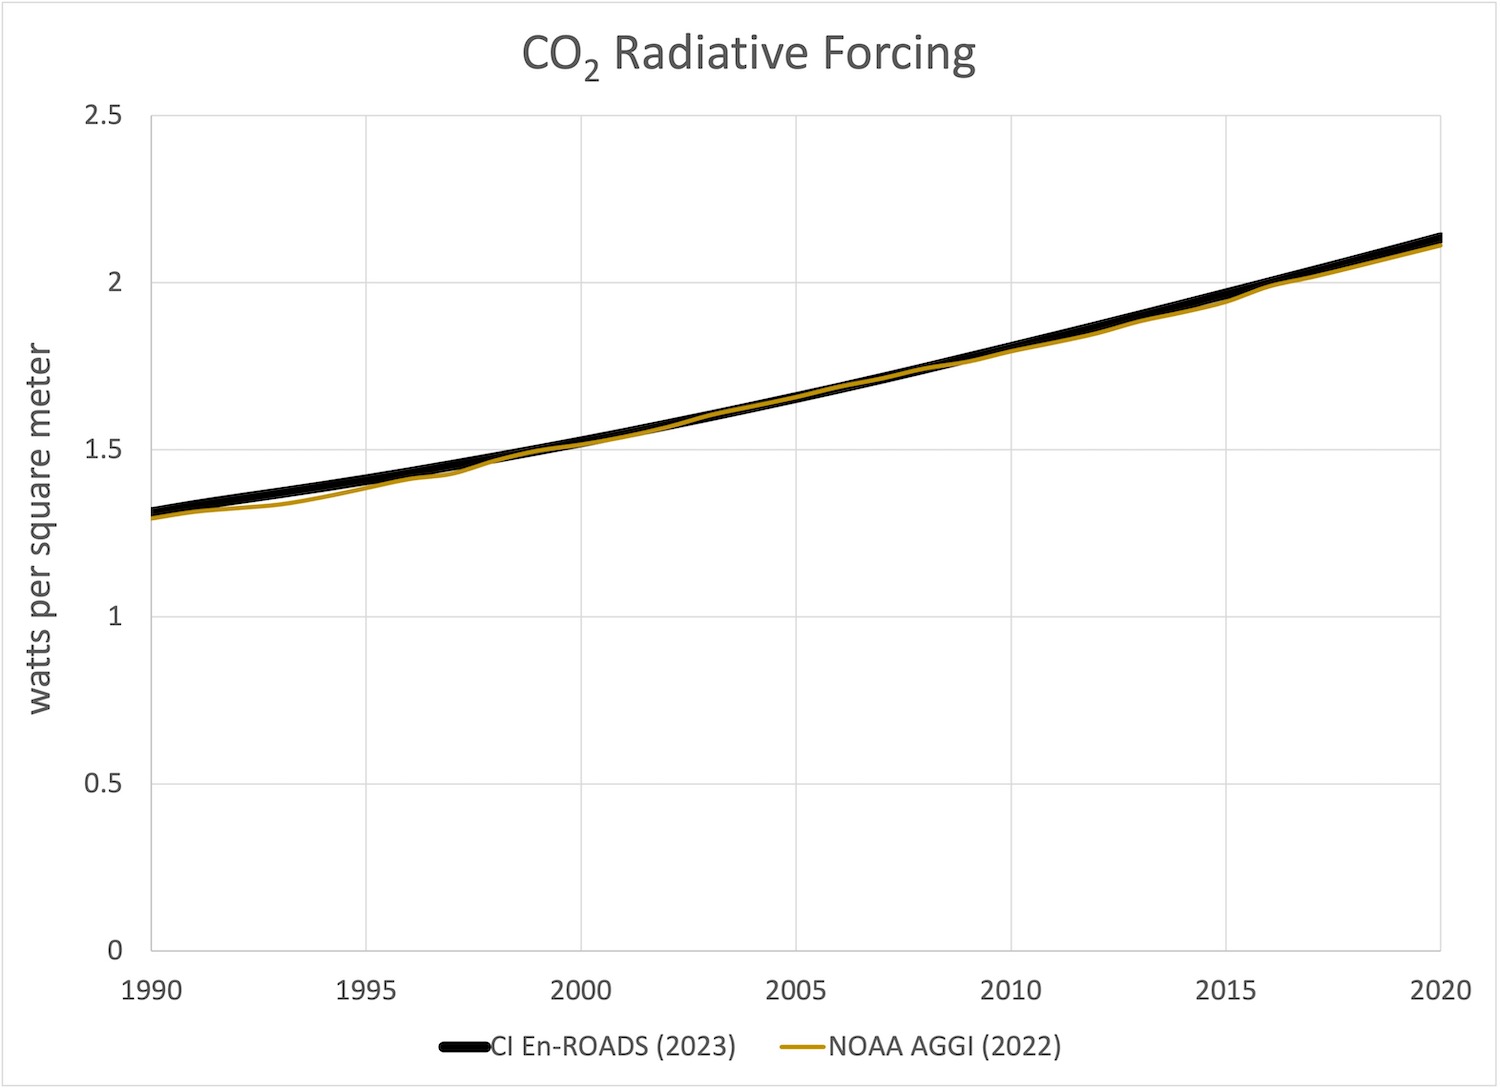
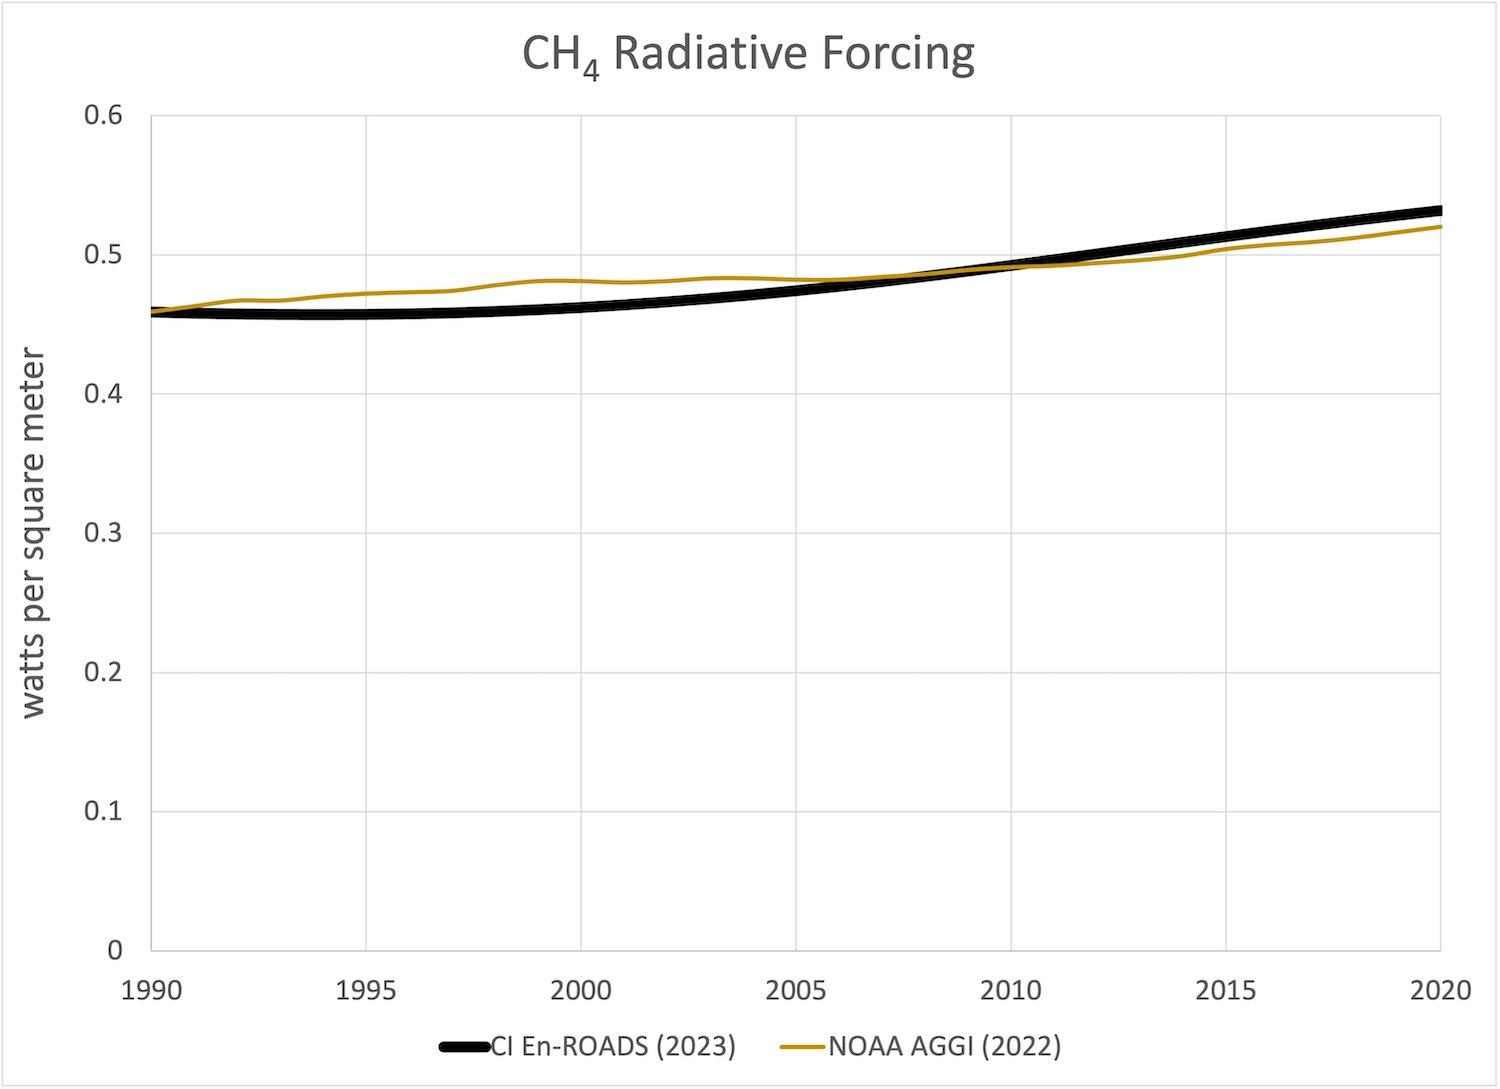
The radiative forcing due to CO2, CH4, N2O, and halocarbons in the atmosphere, in watts per meter squared (W/m2), in the En-ROADS Baseline Scenario compared to historical data. Halocarbons refer to F-gases (HFCs, PFCs, and SF6) and Montreal gases (ozone-depleting substances controlled by the Montreal Protocol).
Greenhouse gases absorb infrared radiation and re-radiate it back, causing an increase in surface temperature. Radiative forcing measures the difference between energy absorbed by the Earth and energy radiated back into space. When incoming energy is greater than outgoing energy, RF is positive and the planet will warm.
Statistical fit🔗
Click here for descriptive statistics of En-ROADS fit to historical data.
Sources of historical data🔗
- NOAA AGGI: NOAA. (2022). Annual Greenhouse Gas Index.
CO2 Radiative Forcing🔗
CH4 Radiative Forcing🔗
N2O Radiative Forcing🔗
Halocarbon Radiative Forcing🔗
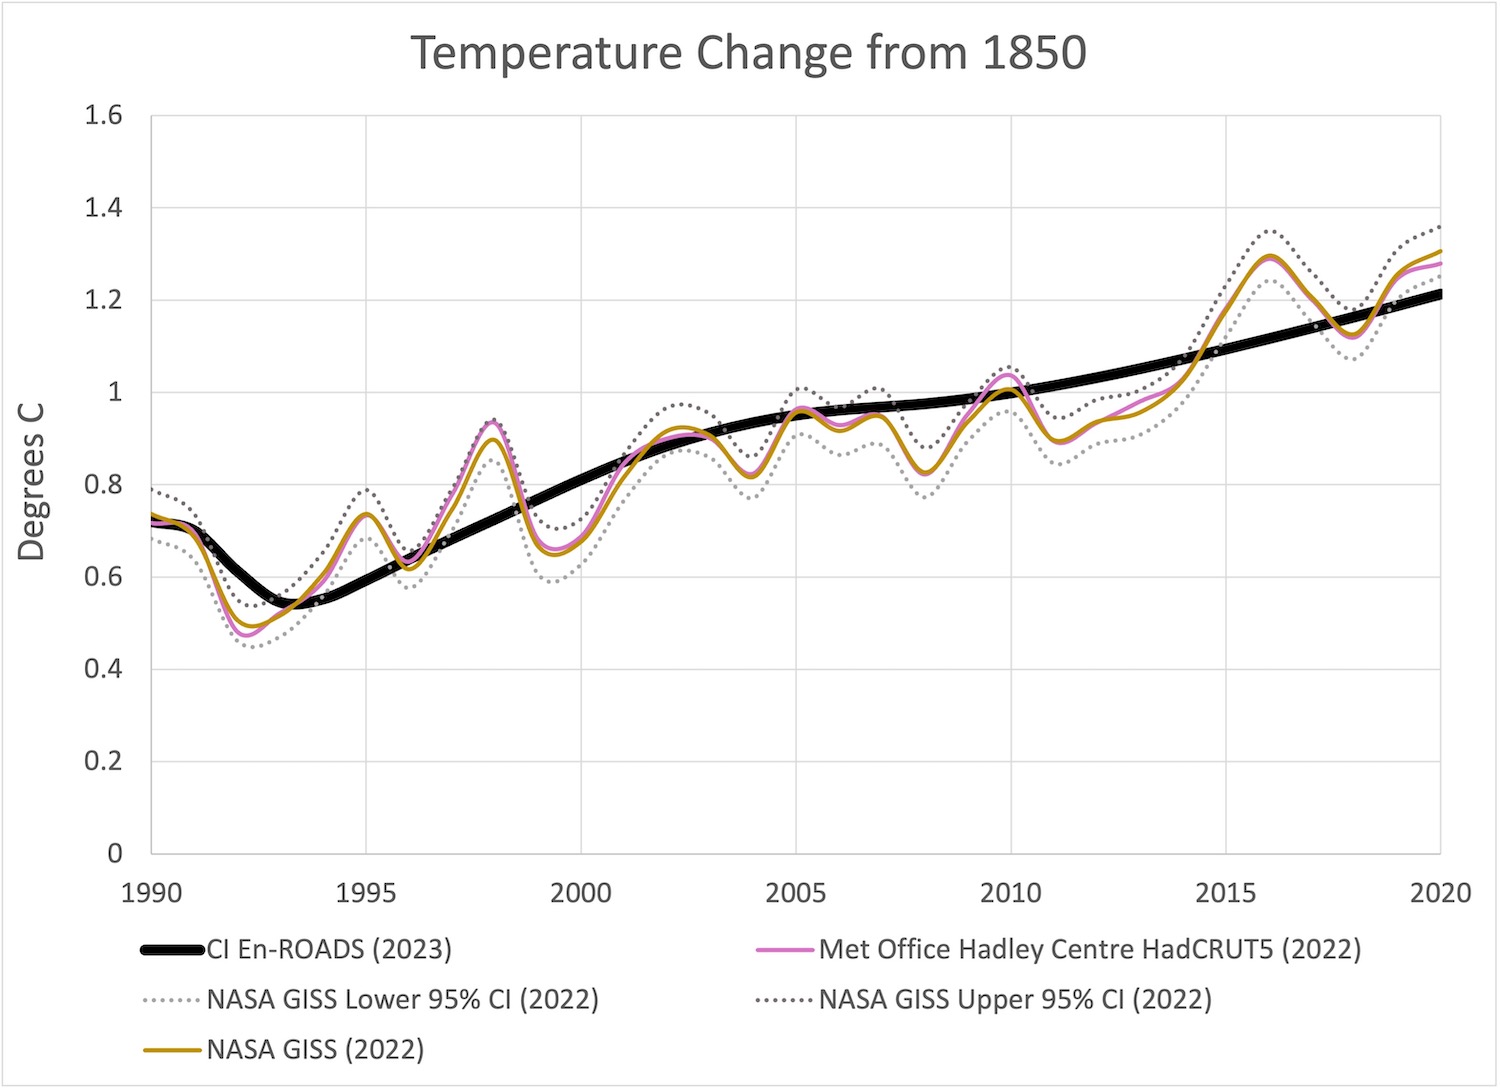
Temperature History🔗
Temperature change from 1850 in the En-ROADS Baseline Scenario compared to historical data, in degrees Celsius. NASA GISS (GISTEMP v4) includes the average and the lower and upper 95% confidence intervals.
Statistical fit🔗
Click here for descriptive statistics of En-ROADS fit to historical data.
Sources of historical data🔗
- NASA GISS. (2022). GISS Surface Temperature Analysis (GISTEMP), version 4. NASA Goddard Institute for Space Studies.
- Met Office Hadley Centre HadCRUT5: Morice, C. P., et al. (2022). An updated assessment of near-surface temperature change from 1850: the HadCRUT5 dataset. Journal of Geophysical Research: Atmospheres, 126, e2019JD032361. Data available at https://www.metoffice.gov.uk/hadobs/hadcrut5/data/current/download.html.
Temperature Change🔗